- Page 1 and 2:
Education at a Glance OECD INDICATO
- Page 3 and 4:
Centre for Educational Research and
- Page 5 and 6:
TABLE OF CONTENTS Name of the indic
- Page 7 and 8:
INTRODUCTION THE OECD EDUCATION IN
- Page 9 and 10:
Introduction ratios and teaching ho
- Page 11 and 12:
Introduction Despite progress in at
- Page 13 and 14:
HIGHLIGHTS PARTICIPATION AND ATTAI
- Page 15 and 16:
Highlights The higher the level of
- Page 17 and 18:
Financial and human resources inves
- Page 19 and 20:
Learning environment and organisati
- Page 21 and 22:
Reader’s Guide education. The Glo
- Page 23 and 24:
RELATIVE SIZE OF THE SCHOOL-AGE POP
- Page 25 and 26:
Relative Size of the School-age Pop
- Page 27 and 28:
Relative Size of the School-age Pop
- Page 29 and 30: Educational Attainment of the Adult
- Page 31 and 32: Educational Attainment of the Adult
- Page 33 and 34: Educational Attainment of the Adult
- Page 35 and 36: Educational Attainment of the Adult
- Page 37 and 38: Educational Attainment of the Adult
- Page 39 and 40: Educational Attainment of the Adult
- Page 41 and 42: Educational Attainment of the Adult
- Page 43 and 44: FINANCIAL AND HUMAN RESOURCES INVES
- Page 45 and 46: EDUCATIONAL EXPENDITURE RELATIVE TO
- Page 47 and 48: Educational Expenditure Relative to
- Page 49 and 50: Educational Expenditure Relative to
- Page 51 and 52: Educational Expenditure Relative to
- Page 53 and 54: Educational Expenditure Relative to
- Page 55 and 56: Educational Expenditure Relative to
- Page 57 and 58: Educational Expenditure Relative to
- Page 59 and 60: Educational Expenditure Relative to
- Page 61 and 62: Educational Expenditure Relative to
- Page 63 and 64: Relative Proportions of Public and
- Page 65 and 66: Relative Proportions of Public and
- Page 67 and 68: Relative Proportions of Public and
- Page 69 and 70: Relative Proportions of Public and
- Page 71 and 72: PUBLIC SUBSIDIES TO HOUSEHOLDS •
- Page 73 and 74: Public Subsidies to Households At t
- Page 75 and 76: Public Subsidies to Households Char
- Page 77 and 78: Public Subsidies to Households Tax
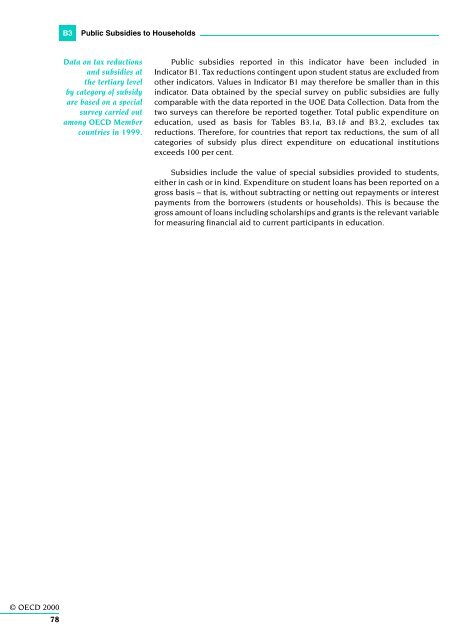
- Page 79: Public Subsidies to Households Crit
- Page 83 and 84: Public Subsidies to Households Tabl
- Page 85 and 86: EDUCATIONAL EXPENDITURE PER STUDENT
- Page 87 and 88: Educational Expenditure per Student
- Page 89 and 90: Educational Expenditure per Student
- Page 91 and 92: Educational Expenditure per Student
- Page 93 and 94: Educational Expenditure per Student
- Page 95 and 96: Educational Expenditure per Student
- Page 97 and 98: Educational Expenditure per Student
- Page 99 and 100: Educational Expenditure per Student
- Page 101 and 102: Educational Expenditure by Resource
- Page 103 and 104: Educational Expenditure by Resource
- Page 105 and 106: Educational Expenditure by Resource
- Page 107 and 108: Public Funds by Level of Government
- Page 109 and 110: Public Funds by Level of Government
- Page 111 and 112: Public Funds by Level of Government
- Page 113 and 114: Public Funds by Level of Government
- Page 115 and 116: Public Funds by Level of Government
- Page 117 and 118: RATIO OF STUDENTS TO TEACHING STAFF
- Page 119 and 120: Ratio of Students to Teaching Staff
- Page 121 and 122: Ratio of Students to Teaching Staff
- Page 123 and 124: C Access to Education, Participatio
- Page 125 and 126: C1 Overall Participation in Educati
- Page 127 and 128: C1 Overall Participation in Educati
- Page 129 and 130: C1 Overall Participation in Educati
- Page 131 and 132:
C1 Overall Participation in Educati
- Page 133 and 134:
C1 Overall Participation in Educati
- Page 135 and 136:
C1 Overall Participation in Educati
- Page 137 and 138:
C1 Overall Participation in Educati
- Page 139 and 140:
PARTICIPATION IN AND COMPLETION OF
- Page 141 and 142:
C2 Participation in and Completion
- Page 143 and 144:
C2 Participation in and Completion
- Page 145 and 146:
C2 Participation in and Completion
- Page 147 and 148:
C2 Participation in and Completion
- Page 149 and 150:
C2 Participation in and Completion
- Page 151 and 152:
ACCESS TO AND PARTICIPATION IN TERT
- Page 153 and 154:
C3 Access to and Participation in T
- Page 155 and 156:
C3 Access to and Participation in T
- Page 157 and 158:
C3 Access to and Participation in T
- Page 159 and 160:
C3 Access to and Participation in T
- Page 161 and 162:
C3 Access to and Participation in T
- Page 163 and 164:
C4 Completion of and Dropout from T
- Page 165 and 166:
C4 Completion of and Dropout from T
- Page 167 and 168:
C4 Completion of and Dropout from T
- Page 169 and 170:
C4 Completion of and Dropout from T
- Page 171 and 172:
C4 Completion of and Dropout from T
- Page 173 and 174:
C4 Completion of and Dropout from T
- Page 175 and 176:
C4 Completion of and Dropout from T
- Page 177 and 178:
C4 Completion of and Dropout from T
- Page 179 and 180:
C5 Foreign Students in Tertiary Edu
- Page 181 and 182:
C5 Foreign Students in Tertiary Edu
- Page 183 and 184:
C5 Foreign Students in Tertiary Edu
- Page 185 and 186:
C5 Foreign Students in Tertiary Edu
- Page 187 and 188:
© OECD 2000 186 Table C5.3. Number
- Page 189 and 190:
C6 Students Receiving Additional Re
- Page 191 and 192:
C6 Students Receiving Additional Re
- Page 193 and 194:
C6 Students Receiving Additional Re
- Page 195 and 196:
C6 Students Receiving Additional Re
- Page 197 and 198:
C7 Participation in Skill Improveme
- Page 199 and 200:
C7 Participation in Skill Improveme
- Page 201 and 202:
C7 Participation in Skill Improveme
- Page 203 and 204:
C7 Participation in Skill Improveme
- Page 205 and 206:
C7 Participation in Skill Improveme
- Page 207 and 208:
D The Learning Environment and Orga
- Page 209 and 210:
D1 Statutory Salaries of Teachers i
- Page 211 and 212:
D1 Statutory Salaries of Teachers i
- Page 213 and 214:
D1 Statutory Salaries of Teachers i
- Page 215 and 216:
D1 Statutory Salaries of Teachers i
- Page 217 and 218:
D1 Statutory Salaries of Teachers i
- Page 219 and 220:
D2 Pre-service Training Requirement
- Page 221 and 222:
D2 Pre-service Training Requirement
- Page 223 and 224:
D2 Pre-service Training Requirement
- Page 225 and 226:
TEACHING TIME • Teaching time aff
- Page 227 and 228:
D3 Teaching Time order to earn a fu
- Page 229 and 230:
D3 Teaching Time DEFINITIONS Teach
- Page 231 and 232:
D3 Teaching Time Table D3.2. How wo
- Page 233 and 234:
TOTAL INTENDED INSTRUCTION TIME FOR
- Page 235 and 236:
D4 Total Intended Instruction Time
- Page 237 and 238:
D4 Total Intended Instruction Time
- Page 239 and 240:
D4 Total Intended Instruction Time
- Page 241 and 242:
D5 Student Absenteeism POLICY CONT
- Page 243 and 244:
DECISION-MAKING ABOUT THE CURRICULU
- Page 245 and 246:
D6 Decision-making About the Curric
- Page 247 and 248:
D6 Decision-making About the Curric
- Page 249 and 250:
COMPUTERS IN SCHOOLS AND THEIR USE
- Page 251 and 252:
D7 Computers in Schools and their U
- Page 253 and 254:
D7 Computers in Schools and their U
- Page 255 and 256:
D7 Computers in Schools and their U
- Page 257 and 258:
INDIVIDUAL, SOCIAL AND LABOUR MARKE
- Page 259 and 260:
LABOUR FORCE PARTICIPATION BY LEVEL
- Page 261 and 262:
Labour Force Participation by Level
- Page 263 and 264:
Labour Force Participation by Level
- Page 265 and 266:
Labour Force Participation by Level
- Page 267 and 268:
Labour Force Participation by Level
- Page 269 and 270:
Labour Force Participation by Level
- Page 271 and 272:
Labour Force Participation by Level
- Page 273 and 274:
Labour Force Participation by Level
- Page 275 and 276:
Education and Work Among the Youth
- Page 277 and 278:
Education and Work Among the Youth
- Page 279 and 280:
Education and Work Among the Youth
- Page 281 and 282:
Education and Work Among the Youth
- Page 283 and 284:
SPECIFIC SITUATION OF THE YOUTH POP
- Page 285 and 286:
Specific Situation of the Youth Pop
- Page 287 and 288:
Specific Situation of the Youth Pop
- Page 289 and 290:
EXPECTED YEARS IN EDUCATION AND WOR
- Page 291 and 292:
Expected Years in Education and Wor
- Page 293 and 294:
EARNINGS AND EDUCATIONAL ATTAINMENT
- Page 295 and 296:
Earnings and Educational Attainment
- Page 297 and 298:
Earnings and Educational Attainment
- Page 299 and 300:
STUDENT ACHIEVEMENT F International
- Page 301 and 302:
F1 Mathematics Achievement of Stude
- Page 303 and 304:
F1 Mathematics Achievement of Stude
- Page 305 and 306:
DIFFERENCES IN STUDENTS’ ATTITUDE
- Page 307 and 308:
F2 Differences in Students’ Attit
- Page 309 and 310:
F2 Differences in Students’ Attit
- Page 311 and 312:
4th- AND 8th-GRADE STUDENTS’ BELI
- Page 313 and 314:
F3 4th- and 8th-grade Students’ B
- Page 315 and 316:
F3 4th- and 8th-grade Students’ B
- Page 317 and 318:
F3 4th- and 8th-grade Students’ B
- Page 319 and 320:
ANNEX 1 Table X1.1b. Typical gradua
- Page 321 and 322:
ANNEX 1 Table X1.2. School years an
- Page 323 and 324:
ANNEX 2 Table X2.2. Basic reference
- Page 325 and 326:
Annex 3 SOURCES, METHODS AND TECHNI
- Page 327 and 328:
Table 1. Description of ISCED-97 le
- Page 329 and 330:
Table 3. Sources Statistical agency
- Page 331 and 332:
ANNEX 3 INDICATOR B1: Educational e
- Page 333 and 334:
ANNEX 3 Czech Republic: Unpublished
- Page 335 and 336:
ANNEX 3 or the financial data, as a
- Page 337 and 338:
ANNEX 3 General notes Notes on meth
- Page 339 and 340:
ANNEX 3 nc courses, with nc > 3, th
- Page 341 and 342:
ANNEX 3 • Calculation of age at t
- Page 343 and 344:
ANNEX 3 Notes on specific countries
- Page 345 and 346:
ANNEX 3 Sources - University surviv
- Page 347 and 348:
ANNEX 3 Ireland: Bonuses refer to e
- Page 349 and 350:
ANNEX 3 Table 4. Requirements for p
- Page 351 and 352:
ANNEX 3 Table 4. Requirements for p
- Page 353 and 354:
ANNEX 3 Table 4. Requirements for p
- Page 355 and 356:
ANNEX 3 Korea: The School Curriculu
- Page 357 and 358:
ANNEX 3 documents applying only to
- Page 359 and 360:
Table 5. Sources Frequency Referenc
- Page 361 and 362:
Table 6. Sources Reference period f
- Page 363 and 364:
ANNEX 3 Table 8. Mean mathematics a
- Page 365 and 366:
GLOSSARY CONTINUING EDUCATIO
- Page 367 and 368:
Glossary by the school); boarding f
- Page 369 and 370:
Glossary tificate, or diploma after
- Page 371 and 372:
Glossary programme at the beginning
- Page 373 and 374:
Glossary UNEMPLOYED The unemploye
- Page 375 and 376:
Contributors to this Publication Ms
- Page 377 and 378:
Contributors to this Publication Mr


