Putting it to Work in Developing Countries - Nathan Associates
Putting it to Work in Developing Countries - Nathan Associates
Putting it to Work in Developing Countries - Nathan Associates

Create successful ePaper yourself
Turn your PDF publications into a flip-book with our unique Google optimized e-Paper software.
Table A-2 (cont<strong>in</strong>ued)<br />
1990 Value (US$ billion) 2004 Value (US$ billion) Change 1990-2004 (%)<br />
Developed Develop<strong>in</strong>g Developed Develop<strong>in</strong>g Developed Develop<strong>in</strong>g<br />
Sec<strong>to</strong>r and Industry <strong>Countries</strong> <strong>Countries</strong> World <strong>Countries</strong> <strong>Countries</strong> World <strong>Countries</strong> <strong>Countries</strong> World<br />
Services<br />
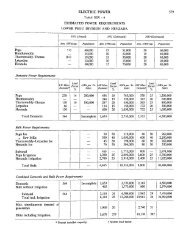
Electric<strong>it</strong>y, gas, and water 6.5 2.7 9.2 167.3 48.7 216.0 2,462.3 1,720.0 2,246.7<br />
Construction 15.4 5.1 20.4 57.5 25.2 82.7 274.6 396.4 304.8<br />
Trade 188.0 23.4 211.4 859.7 189.9 1,049.5 357.2 710.6 396.4<br />
Hotels and restaurants 19.5 3.8 23.3 63.0 19.4 82.4 223.8 404.8 253.6<br />
Transport, s<strong>to</strong>rage, and communications 15.1 11.3 26.4 366.6 130.7 497.3 2,323.3 1,056.9 1,782.0<br />
F<strong>in</strong>ance 272.7 85.3 358.0 1,518.1 306.5 1,824.6 456.7 259.3 409.7<br />
Bus<strong>in</strong>ess activ<strong>it</strong>ies 103.8 14.0 117.7 1,051.1 480.6 1,531.7 912.9 3,339.0 1,200.9<br />
Public adm<strong>in</strong>istration and defense 0.0 0.1 0.1 11.1 0.4 11.5 -- 652.7 20,800.0<br />
Education 0.1 0.0 0.1 0.5 0.1 0.6 496.6 -- 580.5<br />
Health and health services 0.9 0.0 0.9 8.6 2.5 11.1 835.9 -- 1,113.5<br />
Commun<strong>it</strong>y, social, and personal services 12.3 0.0 12.3 68.3 5.9 74.2 456.0 29,470.0 503.2<br />
Other services 66.5 3.9 70.4 107.3 31.5 138.8 61.4 711.3 97.2<br />
Unspecified tertiary 15.8 2.0 17.8 345.9 17.3 363.2 2,088.1 746.7 1,934.9<br />
Sub<strong>to</strong>tal 716.5 151.6 868.1 4,625.0 1,258.6 5,883.6 545.5 730.3 577.7<br />
Private buy<strong>in</strong>g and sell<strong>in</strong>g of property 0.0 0.0 0.0 6.4 0.0 6.4 -- -- -<br />
Unspecified 9.7 4.1 13.8 47.4 78.1 106.6 388.7 1,824.2 675.1<br />
TOTAL 1,452.2 323.7 1,775.9 7,353.1 2,143.1 9,477.4 406.3 562.0 433.7<br />
Notes: Country groups are those used by UNCTAD. UNCTAD classifies some countries as "develop<strong>in</strong>g" that the World Bank considers "high <strong>in</strong>come," such as S<strong>in</strong>gapore and South Korea. UNCTAD also<br />
classifies others as "developed" that the World Bank classifies as “middle <strong>in</strong>come” (e.g., Czech Republic, Es<strong>to</strong>nia, and Hungary). Develop<strong>in</strong>g country data for 2004 <strong>in</strong>clude figures presented <strong>in</strong> WIR 2006 for<br />
South-East Europe and CIS countries.<br />
SOURCE: UNCTAD, World Investment Report 2006, Annex Table A.1.2.