Putting it to Work in Developing Countries - Nathan Associates
Putting it to Work in Developing Countries - Nathan Associates
Putting it to Work in Developing Countries - Nathan Associates

You also want an ePaper? Increase the reach of your titles
YUMPU automatically turns print PDFs into web optimized ePapers that Google loves.
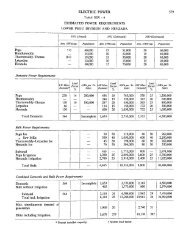
Table 4-1<br />
Sec<strong>to</strong>r Distribution of Estimated Inward FDI S<strong>to</strong>ck, 1990 and 2004 (US$ billion)<br />
Develop<strong>in</strong>g <strong>Countries</strong> a<br />
Other/<br />
Primary Manufactur<strong>in</strong>g Services Unspecified Total<br />
$ % $ % $ % $ % $ %<br />
1990 23.7 7.3 144.4 44.6 151.6 46.8 4.1 1.3 323.7 100.0<br />
2004 151.6 7.4 613.6 30.0 1224.4 60.0 52.5 2.6 2,042.1 100.0<br />
CAAG b 14.2% 10.9% 16.1% 21.8% 14.1%<br />
Developed <strong>Countries</strong><br />
1990 139.6 9.6 586.4 40.4 716.5 49.3 9.7 0.7 1,452.2 100.0<br />
2004 268.2 3.6 2,406.1 32.7 4,624.7 62.9 53.8 0.7 7,352.8 100.0<br />
CAAG 4.8% 10.6% 14.2% 14.1% 12.3%<br />
South-East Europe and CIS<br />
2004 20.7 25.2 20.4 24.9 34.3 41.7 6.7 8.1 82.2 100.0<br />
World<br />
1990 163.3 9.2 730.8 41.1 868.1 48.9 13.8 0.8 1,775.9 100.0<br />
2004 440.5 4.6 3,040.1 32.1 5,883.3 62.1 113.1 1.2 9,477.1 100.0<br />
CAAG 7.3% 10.7% 14.6% 16.2% 12.7%<br />
a Country groups are those used by UNCTAD. UNCTAD classifies some countries as develop<strong>in</strong>g that the World Bank<br />
considers “high <strong>in</strong>come,” such as S<strong>in</strong>gapore and South Korea, and classifies some as developed that the World Bank considers<br />
“low and middle <strong>in</strong>come,” such as Es<strong>to</strong>nia, the Czech Republic and Hungary.<br />
b Compound average annual growth.<br />
c South-East Europe and CIS data are <strong>in</strong>cluded <strong>in</strong> the world <strong>to</strong>tal for 1990, but are not available by sec<strong>to</strong>r and <strong>in</strong>dustry<br />
for that year.<br />
SOURCES: <strong>Nathan</strong> <strong>Associates</strong>, based on UNCTAD, World Investment Report 2006, Annex Table A.1.2.<br />
central <strong>to</strong> <strong>in</strong>ternational manufactur<strong>in</strong>g networks;<br />
and oil attracts the bulk of Africa’s FDI.<br />
INCREASING SHARES OF GLOBAL FDI<br />
STOCK<br />
Just as the sec<strong>to</strong>ral compos<strong>it</strong>ion of FDI is chang<br />
<strong>in</strong>g, so <strong>to</strong>o is the distribution of shares <strong>in</strong> <strong>to</strong>tal<br />
world <strong>in</strong>ward FDI s<strong>to</strong>ck. The latest data suggest<br />
that s<strong>in</strong>ce the beg<strong>in</strong>n<strong>in</strong>g of the 1990s, develop<strong>in</strong>g<br />
countries as a group have <strong>in</strong>creased their<br />
share of the world’s <strong>in</strong>ward FDI s<strong>to</strong>ck <strong>in</strong> all sec<strong>to</strong>rs.<br />
The largest ga<strong>in</strong> has been <strong>in</strong> primary activi<br />
ties, w<strong>it</strong>h much more modest ga<strong>in</strong>s <strong>in</strong> services<br />
and manufactur<strong>in</strong>g (Table 4-2). In all sec<strong>to</strong>rs the<br />
rate of growth of FDI <strong>in</strong>flows <strong>to</strong> develop<strong>in</strong>g<br />
countries has exceeded that of <strong>in</strong>flows <strong>to</strong> devel<br />
oped ones <strong>in</strong> the last 15 years. This is so desp<strong>it</strong>e<br />
(almost 63 percent), hav<strong>in</strong>g grown at the<br />
expense of both manufactur<strong>in</strong>g (33 percent) and<br />
natural resources (4 percent).<br />
The buildup of services FDI <strong>in</strong> the develop<strong>in</strong>g<br />
world differs by region. Investment has tended<br />
<strong>to</strong> flow <strong>to</strong> the wealthier upper-middle <strong>in</strong>come<br />
economies, though exceptions exist (e.g., water<br />
services <strong>in</strong> Manila, Jakarta, or Conakry).<br />
Services therefore loom largest <strong>in</strong> the FDI s<strong>to</strong>ck<br />
of Lat<strong>in</strong> America and the Caribbean and <strong>in</strong><br />
Europe and Central Asia. In contrast, the major<br />
shares of <strong>in</strong>ward FDI s<strong>to</strong>ck <strong>in</strong> East Asia and the<br />
Pacific and <strong>in</strong> Africa are <strong>in</strong> manufactur<strong>in</strong>g and<br />
the primary sec<strong>to</strong>r, respectively (Figure 4-1).<br />
Such regional differences are logical: services<br />
become important as GDP rises; Ch<strong>in</strong>a is<br />
40