Putting it to Work in Developing Countries - Nathan Associates
Putting it to Work in Developing Countries - Nathan Associates
Putting it to Work in Developing Countries - Nathan Associates

Create successful ePaper yourself
Turn your PDF publications into a flip-book with our unique Google optimized e-Paper software.
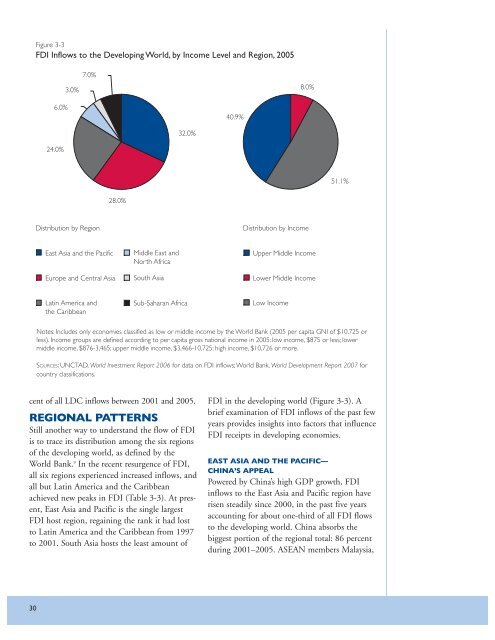
Figure 3-3<br />
FDI Inflows <strong>to</strong> the Develop<strong>in</strong>g World, by Income Level and Region, 2005<br />
3.0%<br />
7.0%<br />
8.0%<br />
6.0%<br />
40.9%<br />
32.0%<br />
24.0%<br />
51.1%<br />
28.0%<br />
Distribution by Region<br />
Distribution by Income<br />
East Asia and the Pacific<br />
Europe and Central Asia<br />
Middle East and<br />
North Africa<br />
South Asia<br />
Upper Middle Income<br />
Lower Middle Income<br />
Lat<strong>in</strong> America and<br />
the Caribbean<br />
Sub-Saharan Africa<br />
Low Income<br />
Notes: Includes only economies classified as low or middle <strong>in</strong>come by the World Bank (2005 per cap<strong>it</strong>a GNI of $10,725 or<br />
less). Income groups are def<strong>in</strong>ed accord<strong>in</strong>g <strong>to</strong> per cap<strong>it</strong>a gross national <strong>in</strong>come <strong>in</strong> 2005: low <strong>in</strong>come, $875 or less; lower<br />
middle <strong>in</strong>come, $876-3,465; upper middle <strong>in</strong>come, $3,466-10,725; high <strong>in</strong>come, $10,726 or more.<br />
SOURCES: UNCTAD, World Investment Report 2006 for data on FDI <strong>in</strong>flows; World Bank, World Development Report 2007 for<br />
country classifications.<br />
cent of all LDC <strong>in</strong>flows between 2001 and 2005.<br />
REGIONAL PATTERNS<br />
Still another way <strong>to</strong> understand the flow of FDI<br />
is <strong>to</strong> trace <strong>it</strong>s distribution among the six regions<br />
of the develop<strong>in</strong>g world, as def<strong>in</strong>ed by the<br />
World Bank. 9 In the recent resurgence of FDI,<br />
all six regions experienced <strong>in</strong>creased <strong>in</strong>flows, and<br />
all but Lat<strong>in</strong> America and the Caribbean<br />
achieved new peaks <strong>in</strong> FDI (Table 3-3). At present,<br />
East Asia and Pacific is the s<strong>in</strong>gle largest<br />
FDI host region, rega<strong>in</strong><strong>in</strong>g the rank <strong>it</strong> had lost<br />
<strong>to</strong> Lat<strong>in</strong> America and the Caribbean from 1997<br />
<strong>to</strong> 2001. South Asia hosts the least amount of<br />
FDI <strong>in</strong> the develop<strong>in</strong>g world (Figure 3-3). A<br />
brief exam<strong>in</strong>ation of FDI <strong>in</strong>flows of the past few<br />
years provides <strong>in</strong>sights <strong>in</strong><strong>to</strong> fac<strong>to</strong>rs that <strong>in</strong>fluence<br />
FDI receipts <strong>in</strong> develop<strong>in</strong>g economies.<br />
EAST ASIA AND THE PACIFIC—<br />
CHINA’S APPEAL<br />
Powered by Ch<strong>in</strong>a’s high GDP growth, FDI<br />
<strong>in</strong>flows <strong>to</strong> the East Asia and Pacific region have<br />
risen steadily s<strong>in</strong>ce 2000, <strong>in</strong> the past five years<br />
account<strong>in</strong>g for about one-third of all FDI flows<br />
<strong>to</strong> the develop<strong>in</strong>g world. Ch<strong>in</strong>a absorbs the<br />
biggest portion of the regional <strong>to</strong>tal: 86 percent<br />
dur<strong>in</strong>g 2001–2005. ASEAN members Malaysia,<br />
30