Putting it to Work in Developing Countries - Nathan Associates
Putting it to Work in Developing Countries - Nathan Associates
Putting it to Work in Developing Countries - Nathan Associates

Create successful ePaper yourself
Turn your PDF publications into a flip-book with our unique Google optimized e-Paper software.
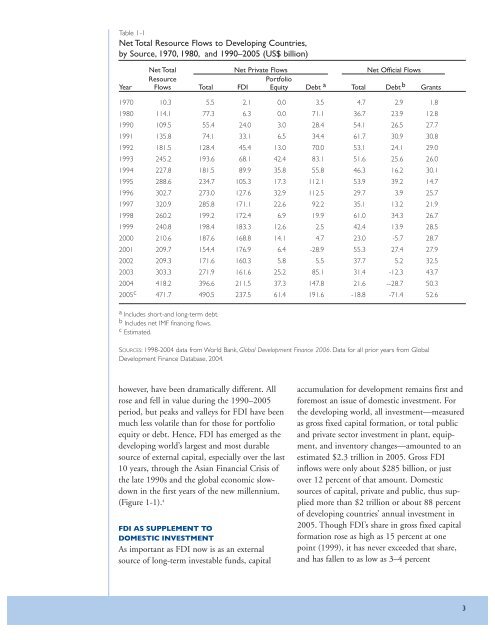
Table 1-1<br />
Net Total Resource Flows <strong>to</strong> Develop<strong>in</strong>g <strong>Countries</strong>,<br />
by Source, 1970, 1980, and 1990–2005 (US$ billion)<br />
Net Total Net Private Flows Net Official Flows<br />
Resource<br />
Portfolio<br />
Year Flows Total FDI Equ<strong>it</strong>y Debt a Total Debt b Grants<br />
1970 10.3 5.5 2.1 0.0 3.5 4.7 2.9 1.8<br />
1980 114.1 77.3 6.3 0.0 71.1 36.7 23.9 12.8<br />
1990 109.5 55.4 24.0 3.0 28.4 54.1 26.5 27.7<br />
1991 135.8 74.1 33.1 6.5 34.4 61.7 30.9 30.8<br />
1992 181.5 128.4 45.4 13.0 70.0 53.1 24.1 29.0<br />
1993 245.2 193.6 68.1 42.4 83.1 51.6 25.6 26.0<br />
1994 227.8 181.5 89.9 35.8 55.8 46.3 16.2 30.1<br />
1995 288.6 234.7 105.3 17.3 112.1 53.9 39.2 14.7<br />
1996 302.7 273.0 127.6 32.9 112.5 29.7 3.9 25.7<br />
1997 320.9 285.8 171.1 22.6 92.2 35.1 13.2 21.9<br />
1998 260.2 199.2 172.4 6.9 19.9 61.0 34.3 26.7<br />
1999 240.8 198.4 183.3 12.6 2.5 42.4 13.9 28.5<br />
2000 210.6 187.6 168.8 14.1 4.7 23.0 -5.7 28.7<br />
2001 209.7 154.4 176.9 6.4 -28.9 55.3 27.4 27.9<br />
2002 209.3 171.6 160.3 5.8 5.5 37.7 5.2 32.5<br />
2003 303.3 271.9 161.6 25.2 85.1 31.4 -12.3 43.7<br />
2004 418.2 396.6 211.5 37.3 147.8 21.6 --28.7 50.3<br />
2005 c 471.7 490.5 237.5 61.4 191.6 -18.8 -71.4 52.6<br />
a Includes short-and long-term debt.<br />
b Includes net IMF f<strong>in</strong>anc<strong>in</strong>g flows.<br />
c Estimated.<br />
SOURCES: 1998-2004 data from World Bank, Global Development F<strong>in</strong>ance 2006. Data for all prior years from Global<br />
Development F<strong>in</strong>ance Database, 2004.<br />
however, have been dramatically different. All accumulation for development rema<strong>in</strong>s first and<br />
rose and fell <strong>in</strong> value dur<strong>in</strong>g the 1990–2005 foremost an issue of domestic <strong>in</strong>vestment. For<br />
period, but peaks and valleys for FDI have been the develop<strong>in</strong>g world, all <strong>in</strong>vestment—measured<br />
much less volatile than for those for portfolio as gross fixed cap<strong>it</strong>al formation, or <strong>to</strong>tal public<br />
equ<strong>it</strong>y or debt. Hence, FDI has emerged as the and private sec<strong>to</strong>r <strong>in</strong>vestment <strong>in</strong> plant, equipdevelop<strong>in</strong>g<br />
world’s largest and most durable ment, and <strong>in</strong>ven<strong>to</strong>ry changes—amounted <strong>to</strong> an<br />
source of external cap<strong>it</strong>al, especially over the last estimated $2.3 trillion <strong>in</strong> 2005. Gross FDI<br />
10 years, through the Asian F<strong>in</strong>ancial Crisis of <strong>in</strong>flows were only about $285 billion, or just<br />
the late 1990s and the global economic slow- over 12 percent of that amount. Domestic<br />
down <strong>in</strong> the first years of the new millennium. sources of cap<strong>it</strong>al, private and public, thus sup<br />
(Figure 1-1). 4<br />
plied more than $2 trillion or about 88 percent<br />
of develop<strong>in</strong>g countries’ annual <strong>in</strong>vestment <strong>in</strong><br />
FDI AS SUPPLEMENT TO<br />
2005. Though FDI’s share <strong>in</strong> gross fixed cap<strong>it</strong>al<br />
DOMESTIC INVESTMENT<br />
formation rose as high as 15 percent at one<br />
As important as FDI now is as an external po<strong>in</strong>t (1999), <strong>it</strong> has never exceeded that share,<br />
source of long-term <strong>in</strong>vestable funds, cap<strong>it</strong>al and has fallen <strong>to</strong> as low as 3–4 percent<br />
3