Putting it to Work in Developing Countries - Nathan Associates
Putting it to Work in Developing Countries - Nathan Associates
Putting it to Work in Developing Countries - Nathan Associates

You also want an ePaper? Increase the reach of your titles
YUMPU automatically turns print PDFs into web optimized ePapers that Google loves.
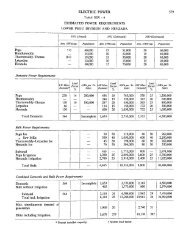
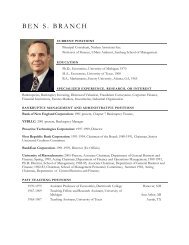
Table 4-3<br />
Estimated FDI Flows <strong>to</strong> 35 Develop<strong>in</strong>g <strong>Countries</strong>, by Source, 1995–2003(US$ billion)<br />
High-<strong>in</strong>come OECD countries<br />
High-<strong>in</strong>come non-OECD<br />
Develop<strong>in</strong>g countries (South-South FDI)<br />
Total <strong>in</strong>flows <strong>in</strong> develop<strong>in</strong>g economies<br />
South-South FDI (percent of <strong>to</strong>tal)<br />
1995 1999 2000 2001 2002 2003<br />
48.1 95.4 93.7 84.8 55.1 59.4<br />
28.2 35.0 22.7 24.8 27.2 22.8<br />
14.0 33.1 38.3 49.7 53.0 47.4<br />
90.3 163.5 154.7 159.3 135.3 129.6<br />
15.5 20.2 24.8 31.2 39.2 36.6<br />
Notes: Based on 35 countries that account for 85 percent of FDI flows <strong>to</strong> develop<strong>in</strong>g countries (economies classified as<br />
low or middle <strong>in</strong>come by the World Bank).<br />
SOURCE: World Bank, Global Development F<strong>in</strong>ance 2006, Volume 1, p. 111.<br />
account for well over one-third of FDI cap<strong>it</strong>al<br />
received by develop<strong>in</strong>g economies (Table 4-3).<br />
Though estimates of the annual amount vary<br />
considerably, South-South flows have been<br />
grow<strong>in</strong>g. World Bank data suggest that the share<br />
of FDI sourced from develop<strong>in</strong>g economies<br />
w<strong>it</strong>h<strong>in</strong> <strong>to</strong>tal FDI received by develop<strong>in</strong>g countries<br />
has more than doubled s<strong>in</strong>ce 1995, from<br />
16 percent <strong>to</strong> 37 percent. 21<br />
SOURCES AND DESTINATIONS<br />
On the basis of estimated <strong>to</strong>tal global FDI outflows,<br />
the key sources of South–South FDI may<br />
be Russia, Ch<strong>in</strong>a, Brazil, Mexico, Indonesia, and<br />
India. 22 Most of this FDI is <strong>in</strong>traregional; FDI<br />
flows w<strong>it</strong>h<strong>in</strong> Asia may account for 80 percent of<br />
all South–South FDI. Intraregional FDI flows<br />
are often directed from a larger, relatively<br />
stronger economy <strong>to</strong> smaller, weaker neighbors.<br />
In Africa, for example, <strong>in</strong>traregional flows are<br />
mostly a function of South African mult<strong>in</strong>ationals<br />
<strong>in</strong>vest<strong>in</strong>g throughout the cont<strong>in</strong>ent. In many<br />
countries (e.g., Democratic Republic of the<br />
Congo, Botswana, Lesotho, Swaziland) South<br />
African FDI represents 50 percent of the <strong>to</strong>tal.<br />
In Asia, FDI from Ch<strong>in</strong>a and ASEAN probably<br />
plays a similarly dom<strong>in</strong>ant role <strong>in</strong> Cambodia,<br />
Myanmar, and Laos.<br />
Interregional flows—FDI transactions among<br />
Asia, Africa, and Lat<strong>in</strong> America—appear modest,<br />
about 6 percent of South–South FDI. Flows<br />
from Asia <strong>to</strong> Africa are estimated <strong>to</strong> be the<br />
largest, well over $1 billion per annum, and<br />
from Lat<strong>in</strong> America <strong>to</strong> Asia the next most<br />
important ($0.7 billion).<br />
MOTIVES<br />
Market-seek<strong>in</strong>g may be the most important<br />
motivation for South–South FDI. 23 These flows<br />
target the manufacture of consumer goods for<br />
local or regional sale, or provision of telecommunications,<br />
construction, or f<strong>in</strong>ancial services<br />
for host country markets and regions. The<br />
Ch<strong>in</strong>ese wh<strong>it</strong>e goods manufacturer Haier, w<strong>it</strong>h<br />
manufactur<strong>in</strong>g <strong>in</strong>vestments <strong>in</strong> Asia and the<br />
Middle East, and the Orascom Group, based <strong>in</strong><br />
Egypt w<strong>it</strong>h foreign affiliates <strong>in</strong> telecoms and<br />
construction <strong>in</strong> the Middle East and Africa, are<br />
examples.<br />
Efficiency-seek<strong>in</strong>g is also an important motivation,<br />
particularly among source economies<br />
whose labor costs have begun <strong>to</strong> rise. Textiles<br />
and apparel and electrical and electronics <strong>in</strong>dustries<br />
are frequently associated w<strong>it</strong>h this efficiency<br />
seek<strong>in</strong>g. In the 1990s, much Ch<strong>in</strong>ese <strong>in</strong>vestment<br />
was driven by the desire <strong>to</strong> use “quota-rich”<br />
African countries as production platforms for<br />
apparel dest<strong>in</strong>ed for the U.S. and EU markets.<br />
F<strong>in</strong>ally, <strong>in</strong> recent years, natural resource seek<strong>in</strong>g<br />
has become an <strong>in</strong>creas<strong>in</strong>gly prom<strong>in</strong>ent FDI<br />
motive. Ch<strong>in</strong>ese and Indian FDI flow<strong>in</strong>g <strong>in</strong><strong>to</strong><br />
Africa is now often associated w<strong>it</strong>h oil and gas<br />
or other extractive <strong>in</strong>dustries. 24 And Russia is<br />
53