Putting it to Work in Developing Countries - Nathan Associates
Putting it to Work in Developing Countries - Nathan Associates
Putting it to Work in Developing Countries - Nathan Associates

You also want an ePaper? Increase the reach of your titles
YUMPU automatically turns print PDFs into web optimized ePapers that Google loves.
countries through mergers and acquis<strong>it</strong>ions, this<br />
type of FDI is small but grow<strong>in</strong>g <strong>in</strong> develop<strong>in</strong>g<br />
countries.<br />
RANKING FDI MOTIVATIONS<br />
Data on FDI <strong>in</strong>flows are not normally recorded<br />
by bus<strong>in</strong>ess purpose. But given certa<strong>in</strong> assumptions<br />
about the nature of various <strong>in</strong>dustries and<br />
their likely attraction for FDI, the relative<br />
importance of <strong>in</strong>ves<strong>to</strong>r motives can be estimated<br />
on the basis of UNCTAD’s figures on FDI<br />
<strong>in</strong>ward s<strong>to</strong>ck by sec<strong>to</strong>r and <strong>in</strong>dustry. 8 Though<br />
rough, these estimates suggest that market-seek<strong>in</strong>g<br />
may still be the dom<strong>in</strong>ant motive, account<strong>in</strong>g<br />
for nearly half of all FDI <strong>in</strong>ward s<strong>to</strong>ck.<br />
Efficiency-seek<strong>in</strong>g FDI is probably the next<br />
most important, followed by FDI for resourceseek<strong>in</strong>g<br />
purposes. This rank<strong>in</strong>g, however, seems<br />
<strong>to</strong> be evolv<strong>in</strong>g: between 1990 and 2004, efficiency-seek<strong>in</strong>g<br />
FDI appeared <strong>to</strong> ga<strong>in</strong> significantly<br />
<strong>in</strong> <strong>it</strong>s share of <strong>to</strong>tal develop<strong>in</strong>g country FDI<br />
s<strong>to</strong>ck, while market<strong>in</strong>g-seek<strong>in</strong>g FDI lost a like<br />
amount (Figure 2-1). Resource-seek<strong>in</strong>g FDI<br />
probably amounts <strong>to</strong> about 8 percent of the<br />
<strong>to</strong>tal accumulated s<strong>to</strong>ck of FDI <strong>in</strong> the develop<strong>in</strong>g<br />
world. W<strong>it</strong>h susta<strong>in</strong>ed global economic<br />
expansion—and especially rapid growth <strong>in</strong><br />
Ch<strong>in</strong>a and India—generat<strong>in</strong>g <strong>in</strong>creased demand<br />
for energy and raw materials, the resource-seek<strong>in</strong>g<br />
share <strong>in</strong> <strong>to</strong>tal FDI could rise somewhat.<br />
THE DEVELOPMENT CASE<br />
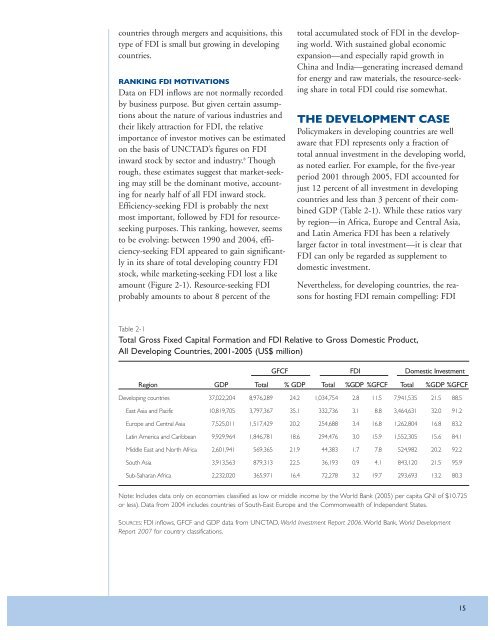
Policymakers <strong>in</strong> develop<strong>in</strong>g countries are well<br />
aware that FDI represents only a fraction of<br />
<strong>to</strong>tal annual <strong>in</strong>vestment <strong>in</strong> the develop<strong>in</strong>g world,<br />
as noted earlier. For example, for the five-year<br />
period 2001 through 2005, FDI accounted for<br />
just 12 percent of all <strong>in</strong>vestment <strong>in</strong> develop<strong>in</strong>g<br />
countries and less than 3 percent of their comb<strong>in</strong>ed<br />
GDP (Table 2-1). While these ratios vary<br />
by region—<strong>in</strong> Africa, Europe and Central Asia,<br />
and Lat<strong>in</strong> America FDI has been a relatively<br />
larger fac<strong>to</strong>r <strong>in</strong> <strong>to</strong>tal <strong>in</strong>vestment—<strong>it</strong> is clear that<br />
FDI can only be regarded as supplement <strong>to</strong><br />
domestic <strong>in</strong>vestment.<br />
Nevertheless, for develop<strong>in</strong>g countries, the reasons<br />
for host<strong>in</strong>g FDI rema<strong>in</strong> compell<strong>in</strong>g: FDI<br />
Table 2-1<br />
Total Gross Fixed Cap<strong>it</strong>al Formation and FDI Relative <strong>to</strong> Gross Domestic Product,<br />
All Develop<strong>in</strong>g <strong>Countries</strong>, 2001-2005 (US$ million)<br />
GFCF FDI Domestic Investment<br />
Region<br />
Develop<strong>in</strong>g countries<br />
East Asia and Pacific<br />
Europe and Central Asia<br />
Lat<strong>in</strong> America and Caribbean<br />
Middle East and North Africa<br />
South Asia<br />
Sub-Saharan Africa<br />
GDP Total % GDP Total %GDP %GFCF Total %GDP %GFCF<br />
37,022,204 8,976,289 24.2 1,034,754 2.8 11.5 7,941,535 21.5 88.5<br />
10,819,705 3,797,367 35.1 332,736 3.1 8.8 3,464,631 32.0 91.2<br />
7,525,011 1,517,429 20.2 254,688 3.4 16.8 1,262,804 16.8 83.2<br />
9,929,964 1,846,781 18.6 294,476 3.0 15.9 1,552,305 15.6 84.1<br />
2,601,941 569,365 21.9 44,383 1.7 7.8 524,982 20.2 92.2<br />
3,913,563 879,313 22.5 36,193 0.9 4.1 843,120 21.5 95.9<br />
2,232,020 365,971 16.4 72,278 3.2 19.7 293,693 13.2 80.3<br />
Note: Includes data only on economies classified as low or middle <strong>in</strong>come by the World Bank (2005) per cap<strong>it</strong>a GNI of $10.725<br />
or less). Data from 2004 <strong>in</strong>cludes countries of South-East Europe and the Commonwealth of Independent States.<br />
SOURCES: FDI <strong>in</strong>flows, GFCF and GDP data from UNCTAD, World Investment Report 2006. World Bank, World Development<br />
Report 2007 for country classifications.<br />
15