4. Developing the Taxi Transformation Plan - SPAD
4. Developing the Taxi Transformation Plan - SPAD
4. Developing the Taxi Transformation Plan - SPAD

You also want an ePaper? Increase the reach of your titles
YUMPU automatically turns print PDFs into web optimized ePapers that Google loves.
A transport model has been used to assess future travel patterns resulting from <strong>the</strong> land uses and<br />
assuming different network scenarios. The resulting travel time and accessibility patterns have<br />
been mapped against <strong>the</strong> existing situation of taxi.<br />
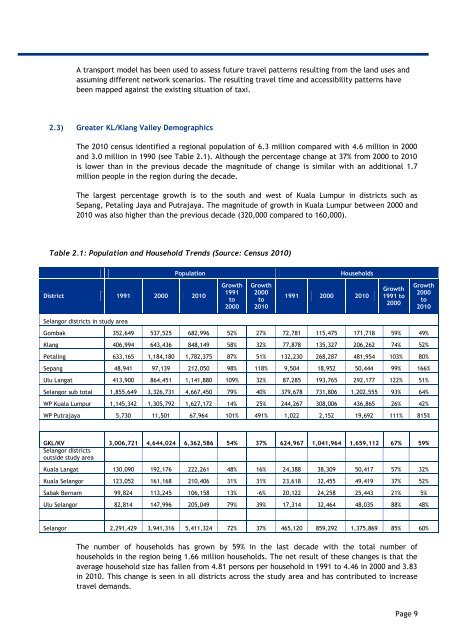
2.3) Greater KL/Klang Valley Demographics<br />
The 2010 census identified a regional population of 6.3 million compared with <strong>4.</strong>6 million in 2000<br />
and 3.0 million in 1990 (see Table 2.1). Although <strong>the</strong> percentage change at 37% from 2000 to 2010<br />
is lower than in <strong>the</strong> previous decade <strong>the</strong> magnitude of change is similar with an additional 1.7<br />
million people in <strong>the</strong> region during <strong>the</strong> decade.<br />
The largest percentage growth is to <strong>the</strong> south and west of Kuala Lumpur in districts such as<br />
Sepang, Petaling Jaya and Putrajaya. The magnitude of growth in Kuala Lumpur between 2000 and<br />
2010 was also higher than <strong>the</strong> previous decade (320,000 compared to 160,000).<br />
Table 2.1: Population and Household Trends (Source: Census 2010)<br />
Population<br />
Households<br />
District 1991 2000 2010<br />
Growth<br />
1991<br />
to<br />
2000<br />
Growth<br />
2000<br />
to<br />
2010<br />
1991 2000 2010<br />
Growth<br />
1991 to<br />
2000<br />
Growth<br />
2000<br />
to<br />
2010<br />
Selangor districts in study area<br />
Gombak 352,649 537,525 682,996 52% 27% 72,781 115,475 171,718 59% 49%<br />
Klang 406,994 643,436 848,149 58% 32% 77,878 135,327 206,262 74% 52%<br />
Petaling 633,165 1,184,180 1,782,375 87% 51% 132,230 268,287 481,954 103% 80%<br />
Sepang 48,941 97,139 212,050 98% 118% 9,504 18,952 50,444 99% 166%<br />
Ulu Langat 413,900 864,451 1,141,880 109% 32% 87,285 193,765 292,177 122% 51%<br />
Selangor sub total 1,855,649 3,326,731 4,667,450 79% 40% 379,678 731,806 1,202,555 93% 64%<br />
WP Kuala Lumpur 1,145,342 1,305,792 1,627,172 14% 25% 244,267 308,006 436,865 26% 42%<br />
WP Putrajaya 5,730 11,501 67,964 101% 491% 1,022 2,152 19,692 111% 815%<br />
GKL/KV 3,006,721 4,644,024 6,362,586 54% 37% 624,967 1,041,964 1,659,112 67% 59%<br />
Selangor districts<br />
outside study area<br />
Kuala Langat 130,090 192,176 222,261 48% 16% 24,388 38,309 50,417 57% 32%<br />
Kuala Selangor 123,052 161,168 210,406 31% 31% 23,618 32,455 49,419 37% 52%<br />
Sabak Bernam 99,824 113,245 106,158 13% -6% 20,122 24,258 25,443 21% 5%<br />
Ulu Selangor 82,814 147,996 205,049 79% 39% 17,314 32,464 48,035 88% 48%<br />
Selangor 2,291,429 3,941,316 5,411,324 72% 37% 465,120 859,292 1,375,869 85% 60%<br />
The number of households has grown by 59% in <strong>the</strong> last decade with <strong>the</strong> total number of<br />
households in <strong>the</strong> region being 1.66 million households. The net result of <strong>the</strong>se changes is that <strong>the</strong><br />
average household size has fallen from <strong>4.</strong>81 persons per household in 1991 to <strong>4.</strong>46 in 2000 and 3.83<br />
in 2010. This change is seen in all districts across <strong>the</strong> study area and has contributed to increase<br />
travel demands.<br />
Page 9