COPY OF FINAL PROSPECTUS - Mirabela Nickel
COPY OF FINAL PROSPECTUS - Mirabela Nickel
COPY OF FINAL PROSPECTUS - Mirabela Nickel

You also want an ePaper? Increase the reach of your titles
YUMPU automatically turns print PDFs into web optimized ePapers that Google loves.
MIRABELA NICKEL LIMITED<br />
NOTES TO FINANCIAL STATEMENTS (Continued)<br />
For the year ended 30 June 2006<br />
25. EXPLANATION <strong>OF</strong> TRANSITION TO AUSTRALIAN EQUIVALENTS TO IFRS<br />
As stated in significant accounting policies note 1(a), these are the consolidated entity’s first consolidated financial statements prepared<br />
in accordance with AIFRSs.<br />
The policies set out in the significant accounting policies section of this report have been applied in preparing the financial statements<br />
for the financial year ended 30 June 2006, the comparative information presented in these financial statements for the financial year<br />
ended 30 June 2005 and in the preparation of an opening AIFRS balance sheet at 1 July 2004 (the consolidated entity’s date<br />
of transition).<br />
In preparing its opening AIFRS balance sheet, the consolidated entity has adjusted amounts reported previously in financial statements<br />
prepared in accordance with its old basis of accounting (previous GAAP). An explanation of how the transition from previous GAAP to<br />
AIFRSs has affected the consolidated entity’s financial position, financial performance and cash flows is set out in the following tables<br />
and the notes that accompany the tables.<br />
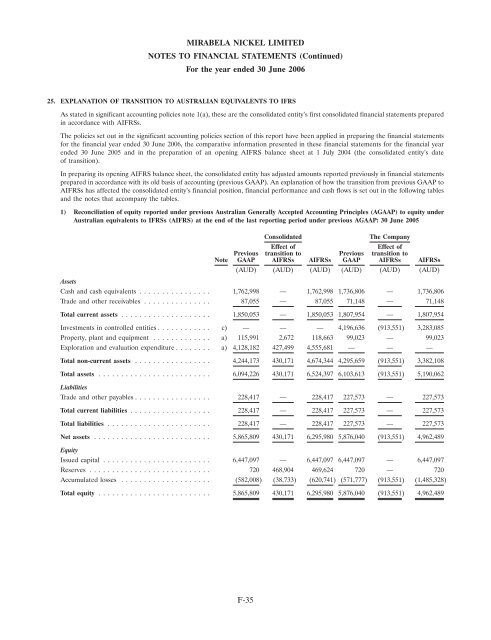
1) Reconciliation of equity reported under previous Australian Generally Accepted Accounting Principles (AGAAP) to equity under<br />
Australian equivalents to IFRSs (AIFRS) at the end of the last reporting period under previous AGAAP: 30 June 2005<br />
Consolidated<br />
The Company<br />
Effect of<br />
Effect of<br />
Previous transition to Previous transition to<br />
Note GAAP AIFRSs AIFRSs GAAP AIFRSs AIFRSs<br />
(AUD) (AUD) (AUD) (AUD) (AUD) (AUD)<br />
Assets<br />
Cash and cash equivalents ................ 1,762,998 — 1,762,998 1,736,806 — 1,736,806<br />
Trade and other receivables ............... 87,055 — 87,055 71,148 — 71,148<br />
Total current assets .................... 1,850,053 — 1,850,053 1,807,954 — 1,807,954<br />
Investments in controlled entities ............ c) — — — 4,196,636 (913,551) 3,283,085<br />
Property, plant and equipment ............. a) 115,991 2,672 118,663 99,023 — 99,023<br />
Exploration and evaluation expenditure ........ a) 4,128,182 427,499 4,555,681 — — —<br />
Total non-current assets ................. 4,244,173 430,171 4,674,344 4,295,659 (913,551) 3,382,108<br />
Total assets ......................... 6,094,226 430,171 6,524,397 6,103,613 (913,551) 5,190,062<br />
Liabilities<br />
Trade and other payables ................. 228,417 — 228,417 227,573 — 227,573<br />
Total current liabilities .................. 228,417 — 228,417 227,573 — 227,573<br />
Total liabilities ....................... 228,417 — 228,417 227,573 — 227,573<br />
Net assets .......................... 5,865,809 430,171 6,295,980 5,876,040 (913,551) 4,962,489<br />
Equity<br />
Issued capital ........................ 6,447,097 — 6,447,097 6,447,097 — 6,447,097<br />
Reserves ........................... 720 468,904 469,624 720 — 720<br />
Accumulated losses .................... (582,008) (38,733) (620,741) (571,777) (913,551) (1,485,328)<br />
Total equity ......................... 5,865,809 430,171 6,295,980 5,876,040 (913,551) 4,962,489<br />
F-35