Download full report in pdf format - Natural Resources Institute
Download full report in pdf format - Natural Resources Institute
Download full report in pdf format - Natural Resources Institute

You also want an ePaper? Increase the reach of your titles
YUMPU automatically turns print PDFs into web optimized ePapers that Google loves.
250<br />
200<br />
Ra<strong>in</strong>fall/ETp (mm)<br />
150<br />
100<br />
50<br />
0<br />
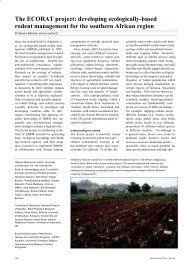
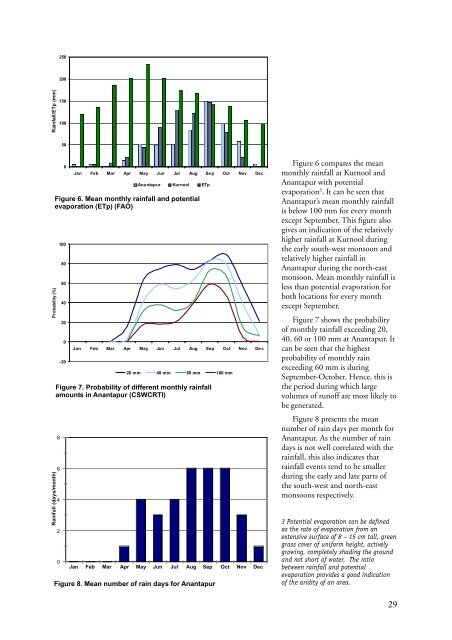
Figure 6. Mean monthly ra<strong>in</strong>fall and potential<br />
evaporation (ETp) (FAO)<br />
Probability (%)<br />
Ra<strong>in</strong>fall (days/month)<br />
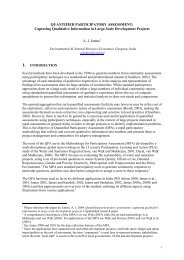
Figure 7. Probability of different monthly ra<strong>in</strong>fall<br />
amounts <strong>in</strong> Anantapur (CSWCRTI)<br />
8<br />
6<br />
4<br />
2<br />
0<br />
100<br />
80<br />
60<br />
40<br />
20<br />
0<br />
-20<br />
Jan Feb Mar Apr May Jun Jul Aug Se p Oct Nov Dec<br />
Ana ntapur Kurnool ETp<br />
Jan Feb Mar Apr May Jun Jul Aug Sep Oct Nov Dec<br />
20 mm 40 mm 60 mm 100 mm<br />
Jan Feb Mar Apr May Jun Jul Aug Sep Oct Nov Dec<br />
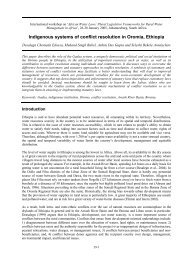
Figure 8. Mean number of ra<strong>in</strong> days for Anantapur<br />
Figure 6 compares the mean<br />
monthly ra<strong>in</strong>fall at Kurnool and<br />
Anantapur with potential<br />
evaporation 3 . It can be seen that<br />
Anantapur’s mean monthly ra<strong>in</strong>fall<br />
is below 100 mm for every month<br />
except September. This figure also<br />
gives an <strong>in</strong>dication of the relatively<br />
higher ra<strong>in</strong>fall at Kurnool dur<strong>in</strong>g<br />
the early south-west monsoon and<br />
relatively higher ra<strong>in</strong>fall <strong>in</strong><br />
Anantapur dur<strong>in</strong>g the north-east<br />
monsoon. Mean monthly ra<strong>in</strong>fall is<br />
less than potential evaporation for<br />
both locations for every month<br />
except September.<br />
Figure 7 shows the probability<br />
of monthly ra<strong>in</strong>fall exceed<strong>in</strong>g 20,<br />
40, 60 or 100 mm at Anantapur. It<br />
can be seen that the highest<br />
probability of monthly ra<strong>in</strong><br />
exceed<strong>in</strong>g 60 mm is dur<strong>in</strong>g<br />
September-October. Hence, this is<br />
the period dur<strong>in</strong>g which large<br />
volumes of runoff are most likely to<br />
be generated.<br />
Figure 8 presents the mean<br />
number of ra<strong>in</strong> days per month for<br />
Anantapur. As the number of ra<strong>in</strong><br />
days is not well correlated with the<br />
ra<strong>in</strong>fall, this also <strong>in</strong>dicates that<br />
ra<strong>in</strong>fall events tend to be smaller<br />
dur<strong>in</strong>g the early and late parts of<br />
the south-west and north-east<br />
monsoons respectively.<br />
3 Potential evaporation can be def<strong>in</strong>ed<br />
as the rate of evaporation from an<br />
extensive surface of 8 – 15 cm tall, green<br />
grass cover of uniform height, actively<br />
grow<strong>in</strong>g, completely shad<strong>in</strong>g the ground<br />
and not short of water. The ratio<br />
between ra<strong>in</strong>fall and potential<br />
evaporation provides a good <strong>in</strong>dication<br />
of the aridity of an area.<br />
29