Download full report in pdf format - Natural Resources Institute
Download full report in pdf format - Natural Resources Institute
Download full report in pdf format - Natural Resources Institute

Create successful ePaper yourself
Turn your PDF publications into a flip-book with our unique Google optimized e-Paper software.
4.2 Surface water resources<br />
Runoff at the regional and large<br />
watershed scale<br />
Analysis of gaug<strong>in</strong>g data from the Central<br />
Water Commission (CWC) showed that annual<br />
surface runoff, at the macro-watershed or bas<strong>in</strong><br />
scale, is somewhat lower than is often <strong>report</strong>ed<br />
or than accepted wisdom would suggest<br />
(see Table 8). With the exception of one river,<br />
the Kunderu at Alladapalle, the average annual<br />
runoff values are with<strong>in</strong> the range 4-35 mm<br />
which is equivalent to between 0.8 and 7.5% of<br />
ra<strong>in</strong>fall. The ma<strong>in</strong> reason for the apparent higher<br />
runoff <strong>in</strong> the Kunderu is the fact that this river is<br />
used for <strong>in</strong>ter-bas<strong>in</strong> transfer of Krishna River<br />
water. The relatively low runoff values observed<br />
at most gaug<strong>in</strong>g stations challenge the<br />
widespread assumption that runoff <strong>in</strong> this region<br />
is always <strong>in</strong> the range 30-40% of annual ra<strong>in</strong>fall.<br />
Although significant volumes of water can dra<strong>in</strong><br />
<strong>in</strong>to the Bay of Bengal dur<strong>in</strong>g periods or years<br />
with exceptionally high ra<strong>in</strong>fall, <strong>in</strong> general,<br />
runoff represents a relatively small loss from the<br />
region.<br />
The runoff figures presented <strong>in</strong> Table 8<br />
agree with the low runoff values <strong>report</strong>ed <strong>in</strong> the<br />
KAWAD Water Audit Report (Batchelor et al.,<br />
2000) for large watersheds. They are also<br />
consistent with the characteristics of the area<br />
(e.g. semi-arid climate, extensive development<br />
of water harvest<strong>in</strong>g structures).<br />
Figure 28 compares annual ra<strong>in</strong>fall and<br />
runoff at the CWC Tadapatri gaug<strong>in</strong>g station<br />
on the Pennar River. This figure shows the<br />
considerable <strong>in</strong>ter-annual variation <strong>in</strong> ra<strong>in</strong>fall<br />
and surface runoff and that there have been long<br />
<strong>in</strong>tervals of virtually no surface flow dur<strong>in</strong>g this<br />
25 year period (e.g 1990-1996).<br />
Figure 29 compares monthly ra<strong>in</strong>fall and<br />
runoff at Tadapatri. In addition to <strong>in</strong>dicat<strong>in</strong>g<br />
levels of variability, this figure shows that on<br />
average 80% of annual runoff occurs dur<strong>in</strong>g the<br />
three months September to November.<br />
In conclusion, the ma<strong>in</strong> po<strong>in</strong>ts from the<br />
runoff analysis us<strong>in</strong>g CWC data are:<br />
. Throughout southern Andhra Pradesh,<br />
average annual runoff values at the large<br />
watershed scale, <strong>in</strong> the absence of <strong>in</strong>terbas<strong>in</strong><br />
transfers, are <strong>in</strong> the range 1% and<br />
8% of average annual ra<strong>in</strong>fall.<br />
. Ra<strong>in</strong>fall and runoff are extremely variable<br />
both with<strong>in</strong> and between years.<br />
Cop<strong>in</strong>g with seasonality <strong>in</strong> surface water<br />
availability and droughts and floods is<br />
therefore a key issue.<br />
. Although scope for further development<br />
of surface water resources along with<br />
regulation of river flows is possible <strong>in</strong><br />
some areas, the scale of this development<br />
is much lower than suggested by some<br />
GoAP programmes.<br />
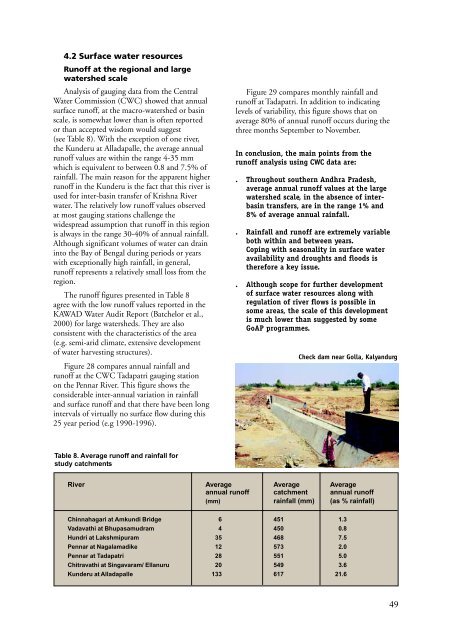
Check dam near Golla, Kalyandurg<br />
Table 8. Average runoff and ra<strong>in</strong>fall for<br />
study catchments<br />
River Average Average Average<br />
annual runoff catchment annual runoff<br />
(mm) ra<strong>in</strong>fall (mm) (as % ra<strong>in</strong>fall)<br />
Ch<strong>in</strong>nahagari at Amkundi Bridge 6 451 1.3<br />
Vadavathi at Bhupasamudram 4 450 0.8<br />
Hundri at Lakshmipuram 35 468 7.5<br />
Pennar at Nagalamadike 12 573 2.0<br />
Pennar at Tadapatri 28 551 5.0<br />
Chitravathi at S<strong>in</strong>gavaram/ Ellanuru 20 549 3.6<br />
Kunderu at Alladapalle 133 617 21.6<br />
49