- Page 1:
ANNUAL REPORT 2011-12 INSURANCE REG
- Page 5 and 6:
ANNUAL REPORT 2011-12 CONTENTS MISS
- Page 7 and 8:
ANNUAL REPORT 2011-12 IV.4 Promotio
- Page 9 and 10:
ANNUAL REPORT 2011-12 I.49 TPA Infr
- Page 11 and 12:
ANNUAL REPORT 2011-12 20. Solvency
- Page 13:
ANNUAL REPORT 2011-12 LIST OF ANNEX
- Page 17 and 18:
ANNUAL REPORT 2011-12 xvii
- Page 19 and 20:
ANNUAL REPORT 2011-12 xix
- Page 21 and 22:
ANNUAL REPORT 2011-12 xxi
- Page 23 and 24:
ANNUAL REPORT 2011-12 NAME DESIGNAT
- Page 25 and 26:
ANNUAL REPORT 2011-12 NAME MANISH M
- Page 27 and 28:
ANNUAL REPORT 2011-12 OVERVIEW The
- Page 29 and 30:
ANNUAL REPORT 2011-12 in 2010 and f
- Page 31 and 32:
ANNUAL REPORT 2011-12 Formation of
- Page 33 and 34:
ANNUAL REPORT 2011-12 32. The regul
- Page 35 and 36:
ANNUAL REPORT 2011-12 launched an e
- Page 37 and 38:
ANNUAL REPORT 2011-12 adherence to
- Page 39:
ANNUAL REPORT 2011-12 insurers unde
- Page 42 and 43:
ANNUAL REPORT 2011-12 factors. The
- Page 44 and 45:
ANNUAL REPORT 2011-12 This alone ac
- Page 46 and 47:
ANNUAL REPORT 2011-12 STATE-WISE LI
- Page 48 and 49:
ANNUAL REPORT 2011-12 Contd.... BOX
- Page 50 and 51:
ANNUAL REPORT 2011-12 TABLE I.4 PRE
- Page 52 and 53:
ANNUAL REPORT 2011-12 BOX ITEM 2 PE
- Page 54 and 55: ANNUAL REPORT 2011-12 TABLE I.9 COM
- Page 56 and 57: ANNUAL REPORT 2011-12 30
- Page 58 and 59: ANNUAL REPORT 2011-12 I.3.27 Bajaj
- Page 60 and 61: ANNUAL REPORT 2011-12 urban areas o
- Page 62 and 63: ANNUAL REPORT 2011-12 TABLE I.17 CO
- Page 64 and 65: ANNUAL REPORT 2011-12 38
- Page 66 and 67: ANNUAL REPORT 2011-12 TABLE I.25 OP
- Page 68 and 69: ANNUAL REPORT 2011-12 Number of off
- Page 70 and 71: ANNUAL REPORT 2011-12 BOX ITEM 3 IN
- Page 72 and 73: ANNUAL REPORT 2011-12 TABLE I.32 NE
- Page 74 and 75: ANNUAL REPORT 2011-12 I.4.1.3 Anoth
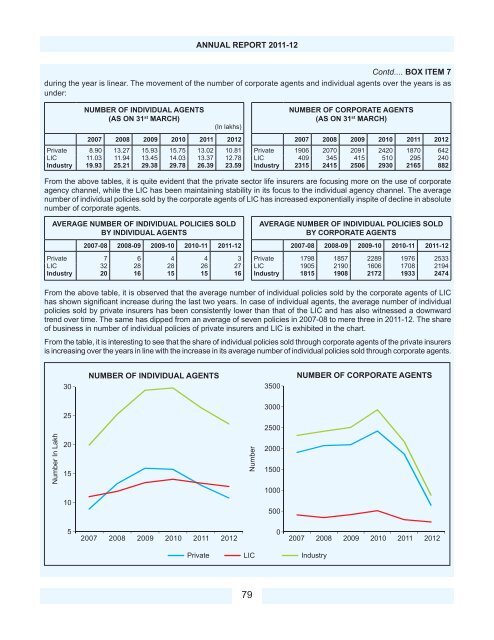
- Page 76 and 77: ANNUAL REPORT 2011-12 Contd.... BOX
- Page 78 and 79: ANNUAL REPORT 2011-12 14(2) Sub Sec
- Page 80 and 81: ANNUAL REPORT 2011-12 Obligatory ce
- Page 82 and 83: ANNUAL REPORT 2011-12 Sr. No. TABLE
- Page 84 and 85: ANNUAL REPORT 2011-12 BOX ITEM 6 FO
- Page 86 and 87: ANNUAL REPORT 2011-12 TABLE I.43 TO
- Page 88 and 89: ANNUAL REPORT 2011-12 Allied Insura
- Page 90 and 91: ANNUAL REPORT 2011-12 SI. No. Name
- Page 92 and 93: ANNUAL REPORT 2011-12 number of liv
- Page 94 and 95: ANNUAL REPORT 2011-12 active consid
- Page 96 and 97: ANNUAL REPORT 2011-12 been piloted
- Page 98 and 99: ANNUAL REPORT 2011-12 TABLE I.54 GR
- Page 100 and 101: ANNUAL REPORT 2011-12 Authority til
- Page 102 and 103: ANNUAL REPORT 2011-12 advised that
- Page 106 and 107: ANNUAL REPORT 2011-12 The share of
- Page 108 and 109: ANNUAL REPORT 2011-12 II.2.5 There
- Page 110 and 111: ANNUAL REPORT 2011-12 Total of Indi
- Page 112 and 113: ANNUAL REPORT 2011-12 TABLE II.7 GR
- Page 114 and 115: ANNUAL REPORT 2011-12 insurance bro
- Page 116 and 117: ANNUAL REPORT 2011-12 authority, ha
- Page 118 and 119: ANNUAL REPORT 2011-12 Financial C
- Page 120 and 121: ANNUAL REPORT 2011-12 cent of compl
- Page 122 and 123: ANNUAL REPORT 2011-12 As per the
- Page 124 and 125: ANNUAL REPORT 2011-12 margin relie
- Page 127 and 128: ANNUAL REPORT 2011-12 PART - III ST
- Page 129 and 130: ANNUAL REPORT 2011-12 and Faculty o
- Page 131 and 132: ANNUAL REPORT 2011-12 III.4.3 The i
- Page 133 and 134: ANNUAL REPORT 2011-12 Authority for
- Page 135 and 136: ANNUAL REPORT 2011-12 in the sector
- Page 137 and 138: ANNUAL REPORT 2011-12 These factors
- Page 139: ANNUAL REPORT 2011-12 the rural and
- Page 142 and 143: ANNUAL REPORT 2011-12 IV.5 RESEARCH
- Page 144 and 145: ANNUAL REPORT 2011-12 compare the g
- Page 146 and 147: ANNUAL REPORT 2011-12 IV.8 IRDA JOU
- Page 149 and 150: ANNUAL REPORT 2011-12 INTERNATIONAL
- Page 151 and 152: ANNUAL REPORT 2011-12 FIRST YEAR (I
- Page 153 and 154: ANNUAL REPORT 2011-12 STATEMENT 5 I
- Page 155 and 156:
ANNUAL REPORT 2011-12 STATEMENT 6 G
- Page 157 and 158:
ANNUAL REPORT 2011-12 STATE WISE IN
- Page 159 and 160:
ANNUAL REPORT 2011-12 STATE WISE IN
- Page 161 and 162:
ANNUAL REPORT 2011-12 STATE WISE GR
- Page 163 and 164:
ANNUAL REPORT 2011-12 STATE WISE GR
- Page 165 and 166:
ANNUAL REPORT 2011-12 STATE WISE GR
- Page 167 and 168:
ANNUAL REPORT 2011-12 STATE WISE GR
- Page 169 and 170:
ANNUAL REPORT 2011-12 INDIVIDUAL BU
- Page 171 and 172:
ANNUAL REPORT 2011-12 LINKED AND NO
- Page 173 and 174:
ANNUAL REPORT 2011-12 LINKED AND NO
- Page 175 and 176:
ANNUAL REPORT 2011-12 INDIVIDUAL DE
- Page 177 and 178:
ANNUAL REPORT 2011-12 GROUP DEATH C
- Page 179 and 180:
ANNUAL REPORT 2011-12 DURATION WISE
- Page 181 and 182:
ANNUAL REPORT 2011-12 Contd... STAT
- Page 183 and 184:
ANNUAL REPORT 2011-12 EQUITY SHARE
- Page 185 and 186:
ANNUAL REPORT 2011-12 LIFE INSURERS
- Page 187 and 188:
ANNUAL REPORT 2011-12 LIFE INSURERS
- Page 189 and 190:
ANNUAL REPORT 2011-12 LIFE INSURERS
- Page 191 and 192:
ANNUAL REPORT 2011-12 LIFE INSURERS
- Page 193 and 194:
ANNUAL REPORT 2011-12 LIFE INSURERS
- Page 195 and 196:
ANNUAL REPORT 2011-12 LIFE INSURERS
- Page 197 and 198:
ANNUAL REPORT 2011-12 STATEMENT 24
- Page 199 and 200:
ANNUAL REPORT 2011-12 STATEMENT 26
- Page 201 and 202:
ANNUAL REPORT 2011-12 STATEMENT 28
- Page 203 and 204:
ANNUAL REPORT 2011-12 DETAILS OF CO
- Page 205 and 206:
ANNUAL REPORT 2011-12 STATEMENT 32
- Page 207 and 208:
ANNUAL REPORT 2011-12 STATE WISE DI
- Page 209 and 210:
ANNUAL REPORT 2011-12 REGION WISE D
- Page 211 and 212:
ANNUAL REPORT 2011-12 STATE WISE DI
- Page 213 and 214:
ANNUAL REPORT 2011-12 STATEMENT 38
- Page 215 and 216:
ANNUAL REPORT 2011-12 Contd... STAT
- Page 217 and 218:
ANNUAL REPORT 2011-12 Contd... STAT
- Page 219 and 220:
ANNUAL REPORT 2011-12 DURATION WISE
- Page 221 and 222:
ANNUAL REPORT 2011-12 GROSS DIRECT
- Page 223 and 224:
ANNUAL REPORT 2011-12 SEGMENT WISE
- Page 225 and 226:
ANNUAL REPORT 2011-12 Contd... STAT
- Page 227 and 228:
ANNUAL REPORT 2011-12 Contd….STAT
- Page 229 and 230:
ANNUAL REPORT 2011-12 STATE-WISE GR
- Page 231 and 232:
ANNUAL REPORT 2011-12 INCURRED CLAI
- Page 233 and 234:
ANNUAL REPORT 2011-12 UNDERWRITING
- Page 235 and 236:
ANNUAL REPORT 2011-12 UNDERWRITING
- Page 237 and 238:
ANNUAL REPORT 2011-12 EQUITY SHARE
- Page 239 and 240:
ANNUAL REPORT 2011-12 PUBLIC SECTOR
- Page 241 and 242:
ANNUAL REPORT 2011-12 PUBLIC SECTOR
- Page 243 and 244:
ANNUAL REPORT 2011-12 PRIVATE SECTO
- Page 245 and 246:
ANNUAL REPORT 2011-12 PRIVATE SECTO
- Page 247 and 248:
ANNUAL REPORT 2011-12 PRIVATE SECTO
- Page 249 and 250:
ANNUAL REPORT 2011-12 PRIVATE SECTO
- Page 251 and 252:
ANNUAL REPORT 2011-12 PRIVATE SECTO
- Page 253 and 254:
ANNUAL REPORT 2011-12 PRIVATE SECTO
- Page 255 and 256:
ANNUAL REPORT 2011-12 HEALTH INSURE
- Page 257 and 258:
ANNUAL REPORT 2011-12 HEALTH INSURE
- Page 259 and 260:
ANNUAL REPORT 2011-12 STATEMENT 68
- Page 261 and 262:
ANNUAL REPORT 2011-12 AGRICULTURE I
- Page 263 and 264:
ANNUAL REPORT 2011-12 AGRICULTURE I
- Page 265 and 266:
ANNUAL REPORT 2011-12 STATEMENT 74
- Page 267 and 268:
ANNUAL REPORT 2011-12 STATE-WISE NU
- Page 269 and 270:
ANNUAL REPORT 2011-12 STATE-WISE CO
- Page 271 and 272:
ANNUAL REPORT 2011-12 STATEMENT 79
- Page 273 and 274:
ANNUAL REPORT 2011-12 STATUS OF GRI
- Page 275 and 276:
ANNUAL REPORT 2011-12 STATEMENT 82
- Page 277:
ANNUAL REPORT 2011-12 STATEMENT 84
- Page 281 and 282:
ANNUAL REPORT 2011-12 ANNEX 1 INSUR
- Page 283 and 284:
ANNUAL REPORT 2011-12 FEE STRUCTURE
- Page 285 and 286:
ANNUAL REPORT 2011-12 ANNEX 3 (ii)
- Page 287 and 288:
ANNUAL REPORT 2011-12 Contd… ANNE
- Page 289 and 290:
ANNUAL REPORT 2011-12 Contd… ANNE
- Page 291 and 292:
ANNUAL REPORT 2011-12 LIST OF MICRO
- Page 293 and 294:
ANNUAL REPORT 2011-12 Contd… ANNE
- Page 295 and 296:
ANNUAL REPORT 2011-12 Contd... ANNE
- Page 297 and 298:
ANNUAL REPORT 2011-12 CIRCULARS/ORD
- Page 299 and 300:
ANNUAL REPORT 2011-12 Contd... ANNE
- Page 301 and 302:
ANNUAL REPORT 2011-12 Contd... ANNE
- Page 303:
ANNUAL REPORT 2011-12 REGULATIONS F