Download PDF - IRDA
Download PDF - IRDA
Download PDF - IRDA

Create successful ePaper yourself
Turn your PDF publications into a flip-book with our unique Google optimized e-Paper software.
ANNUAL REPORT 2011-12<br />
Contd.... BOX ITEM 1<br />
The state-wise data on Gross Domestic Product and per capita Net Domestic Product have been taken from the Central Statistical<br />
Organization (CSO), Ministry of Statistics & Programme Implementation (MoSPI), Government of India. While, the Ministry<br />
publishes both the Gross Domestic Product (GDP) and Net Domestic Product (NDP) for various states/UTs (at current prices<br />
and constant prices), it publishes only Per Capita Net Domestic Product and not the Per Capita Gross Domestic Product. In<br />
accordance with the defi nition of the insurance penetration, the GDP is used for the computation of insurance penetration of<br />
various states and union territories. Further, it is taken at the current prices in order to be compatible with the premium fi gures.<br />
For the scatter plot between insurance penetration and the per capita GDP, the per capita NDP (at current prices) is used, as<br />
the per capita GDP is not available. Although, the per capita GDP can be computed by the formula [per capita GDP = (per capita<br />
NDP) * (GDP) / NDP] for various states / UTs, the same is not applied and rather the per capita NDP, as available directly, is<br />
used as a proxy for the per capita GDP. It may be mentioned that the per capita NDP for majority of states (including All India<br />
fi gure) lies between the range of 85 to 90 per cent of the per capita GDP consistently. Accordingly, by taking the per capita NDP<br />
for the scatter plot, the purpose of examining the nature of relationship between the insurance penetration and per capita GDP<br />
is well served.<br />
The state-wise data on population is available through Census 2001 and Census 2011. These are used to estimate the statewise<br />
population data for various years (2006-07 to 2011-12) using the Compound Average Growth Rate (CAGR) of the respective<br />
states and union territories with application of simple interpolations.<br />
India is a large country with 35 states/union territories with varying levels of per capita GDP, insurance penetration and insurance<br />
density. The per capita NDP of India stood at `60,972 in 2011-12. The same, however, varied signifi cantly across the states and<br />
union territories ranging from a low of `24,681 (for Bihar) to a high of `1,92,652 (for Goa) and `1,75,812 (for Delhi). In the present<br />
context, 3 union territories viz. Dadra & Nagra Haveli, Daman & Diu and Lakshadeep have not been considered because of their<br />
meagre fi gures. Accordingly, 32 states/union territories have only been considered. It may be noted that these three union<br />
territories have insignifi cant contribution in the total life insurance premium.<br />
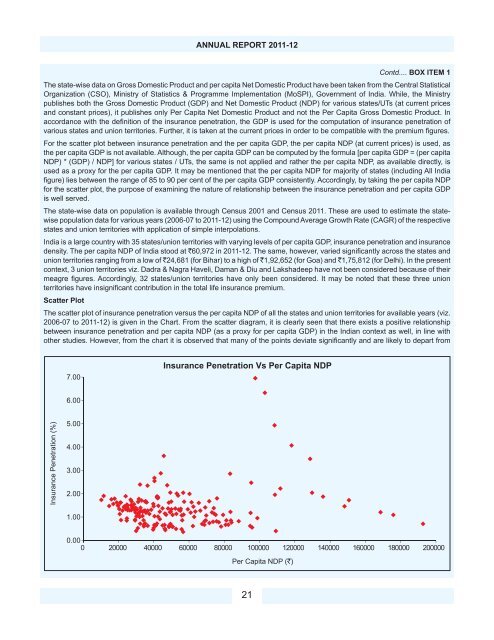
Scatter Plot<br />
The scatter plot of insurance penetration versus the per capita NDP of all the states and union territories for available years (viz.<br />
2006-07 to 2011-12) is given in the Chart. From the scatter diagram, it is clearly seen that there exists a positive relationship<br />
between insurance penetration and per capita NDP (as a proxy for per capita GDP) in the Indian context as well, in line with<br />
other studies. However, from the chart it is observed that many of the points deviate signifi cantly and are likely to depart from<br />
21