Download PDF - IRDA
Download PDF - IRDA
Download PDF - IRDA

Create successful ePaper yourself
Turn your PDF publications into a flip-book with our unique Google optimized e-Paper software.
ANNUAL REPORT 2011-12<br />
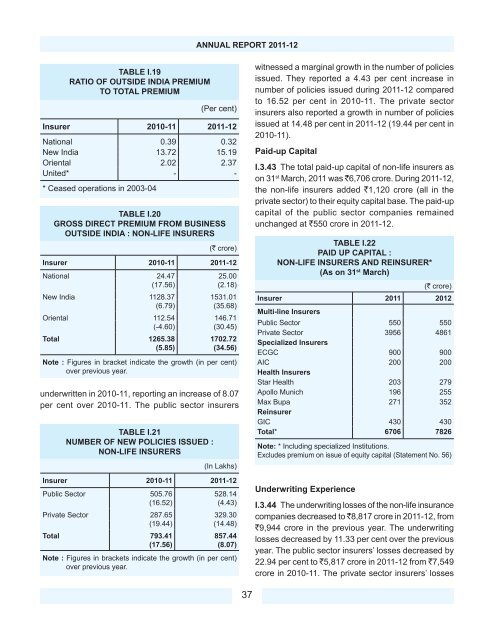
TABLE I.19<br />
RATIO OF OUTSIDE INDIA PREMIUM<br />
TO TOTAL PREMIUM<br />
(Per cent)<br />
Insurer 2010-11 2011-12<br />
National 0.39 0.32<br />
New India 13.72 15.19<br />
Oriental 2.02 2.37<br />
United* - -<br />
* Ceased operations in 2003-04<br />
TABLE I.20<br />
GROSS DIRECT PREMIUM FROM BUSINESS<br />
OUTSIDE INDIA : NON-LIFE INSURERS<br />
(` crore)<br />
Insurer 2010-11 2011-12<br />
National 24.47 25.00<br />
(17.56) (2.18)<br />
New India 1128.37 1531.01<br />
(6.79) (35.68)<br />
Oriental 112.54 146.71<br />
(-4.60) (30.45)<br />
Total 1265.38<br />
(5.85)<br />
1702.72<br />
(34.56)<br />
Note : Figures in bracket indicate the growth (in per cent)<br />
over previous year.<br />
underwritten in 2010-11, reporting an increase of 8.07<br />
per cent over 2010-11. The public sector insurers<br />
TABLE I.21<br />
NUMBER OF NEW POLICIES ISSUED :<br />
NON-LIFE INSURERS<br />
(In Lakhs)<br />
Insurer 2010-11 2011-12<br />
Public Sector 505.76<br />
(16.52)<br />
528.14<br />
(4.43)<br />
Private Sector 287.65 329.30<br />
(19.44) (14.48)<br />
Total 793.41<br />
(17.56)<br />
857.44<br />
(8.07)<br />
Note : Figures in brackets indicate the growth (in per cent)<br />
over previous year.<br />
witnessed a marginal growth in the number of policies<br />
issued. They reported a 4.43 per cent increase in<br />
number of policies issued during 2011-12 compared<br />
to 16.52 per cent in 2010-11. The private sector<br />
insurers also reported a growth in number of policies<br />
issued at 14.48 per cent in 2011-12 (19.44 per cent in<br />
2010-11).<br />
Paid-up Capital<br />
I.3.43 The total paid-up capital of non-life insurers as<br />
on 31 st March, 2011 was `6,706 crore. During 2011-12,<br />
the non-life insurers added `1,120 crore (all in the<br />
private sector) to their equity capital base. The paid-up<br />
capital of the public sector companies remained<br />
unchanged at `550 crore in 2011-12.<br />
TABLE I.22<br />
PAID UP CAPITAL :<br />
NON-LIFE INSURERS AND REINSURER*<br />
(As on 31 st March)<br />
(` crore)<br />
Insurer 2011 2012<br />
Multi-line Insurers<br />
Public Sector 550 550<br />
Private Sector 3956 4861<br />
Specialized Insurers<br />
ECGC 900 900<br />
AIC 200 200<br />
Health Insurers<br />
Star Health 203 279<br />
Apollo Munich 196 255<br />
Max Bupa 271 352<br />
Reinsurer<br />
GIC 430 430<br />
Total* 6706 7826<br />
Note: * Including specialized Institutions.<br />
Excludes premium on issue of equity capital (Statement No. 56)<br />
Underwriting Experience<br />
I.3.44 The underwriting losses of the non-life insurance<br />
companies decreased to `8,817 crore in 2011-12, from<br />
`9,944 crore in the previous year. The underwriting<br />
losses decreased by 11.33 per cent over the previous<br />
year. The public sector insurers’ losses decreased by<br />
22.94 per cent to `5,817 crore in 2011-12 from `7,549<br />
crore in 2010-11. The private sector insurers’ losses<br />
37