Download PDF - IRDA
Download PDF - IRDA
Download PDF - IRDA

Create successful ePaper yourself
Turn your PDF publications into a flip-book with our unique Google optimized e-Paper software.
ANNUAL REPORT 2011-12<br />
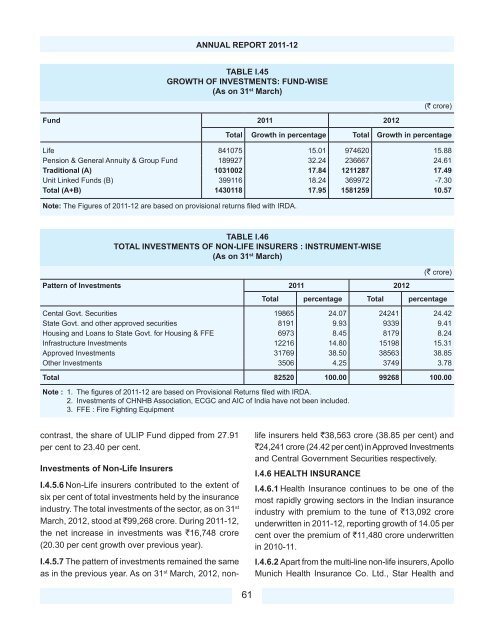
TABLE I.45<br />
GROWTH OF INVESTMENTS: FUND-WISE<br />
(As on 31 st March)<br />
(` crore)<br />
Fund 2011 2012<br />
Total Growth in percentage Total Growth in percentage<br />
Life 841075 15.01 974620 15.88<br />
Pension & General Annuity & Group Fund 189927 32.24 236667 24.61<br />
Traditional (A) 1031002 17.84 1211287 17.49<br />
Unit Linked Funds (B) 399116 18.24 369972 -7.30<br />
Total (A+B) 1430118 17.95 1581259 10.57<br />
Note: The Figures of 2011-12 are based on provisional returns fi led with <strong>IRDA</strong>.<br />
TABLE I.46<br />
TOTAL INVESTMENTS OF NON-LIFE INSURERS : INSTRUMENT-WISE<br />
(As on 31 st March)<br />
(` crore)<br />
Pattern of Investments 2011 2012<br />
Total percentage Total percentage<br />
Cental Govt. Securities 19865 24.07 24241 24.42<br />
State Govt. and other approved securities 8191 9.93 9339 9.41<br />
Housing and Loans to State Govt. for Housing & FFE 6973 8.45 8179 8.24<br />
Infrastructure Investments 12216 14.80 15198 15.31<br />
Approved Investments 31769 38.50 38563 38.85<br />
Other Investments 3506 4.25 3749 3.78<br />
Total 82520 100.00 99268 100.00<br />
Note : 1. The fi gures of 2011-12 are based on Provisional Returns fi led with <strong>IRDA</strong>.<br />
2. Investments of CHNHB Association, ECGC and AIC of India have not been included.<br />
3. FFE : Fire Fighting Equipment<br />
contrast, the share of ULIP Fund dipped from 27.91<br />
per cent to 23.40 per cent.<br />
Investments of Non-Life Insurers<br />
I.4.5.6 Non-Life insurers contributed to the extent of<br />
six per cent of total investments held by the insurance<br />
industry. The total investments of the sector, as on 31 st<br />
March, 2012, stood at `99,268 crore. During 2011-12,<br />
the net increase in investments was `16,748 crore<br />
(20.30 per cent growth over previous year).<br />
I.4.5.7 The pattern of investments remained the same<br />
as in the previous year. As on 31 st March, 2012, nonlife<br />
insurers held `38,563 crore (38.85 per cent) and<br />
`24,241 crore (24.42 per cent) in Approved Investments<br />
and Central Government Securities respectively.<br />
I.4.6 HEALTH INSURANCE<br />
I.4.6.1 Health Insurance continues to be one of the<br />
most rapidly growing sectors in the Indian insurance<br />
industry with premium to the tune of `13,092 crore<br />
underwritten in 2011-12, reporting growth of 14.05 per<br />
cent over the premium of `11,480 crore underwritten<br />
in 2010-11.<br />
I.4.6.2 Apart from the multi-line non-life insurers, Apollo<br />
Munich Health Insurance Co. Ltd., Star Health and<br />
61