Download PDF - IRDA
Download PDF - IRDA
Download PDF - IRDA

Create successful ePaper yourself
Turn your PDF publications into a flip-book with our unique Google optimized e-Paper software.
ANNUAL REPORT 2011-12<br />
TABLE I.43<br />
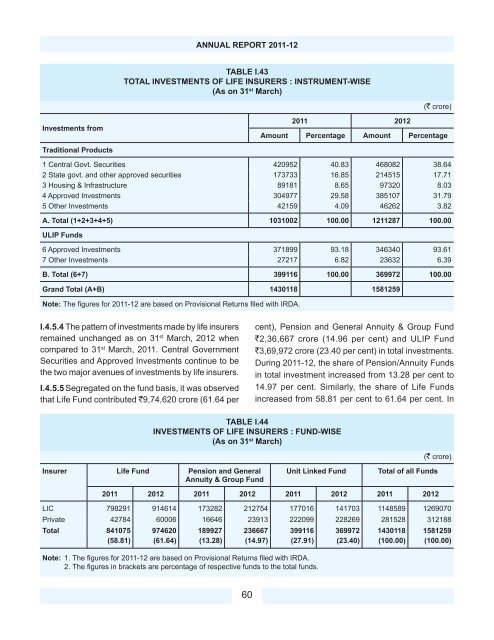
TOTAL INVESTMENTS OF LIFE INSURERS : INSTRUMENT-WISE<br />
(As on 31 st March)<br />
(` crore)<br />
Investments from<br />
2011 2012<br />
Amount Percentage Amount Percentage<br />
Traditional Products<br />
1 Central Govt. Securities 420952 40.83 468082 38.64<br />
2 State govt. and other approved securities 173733 16.85 214515 17.71<br />
3 Housing & Infrastructure 89181 8.65 97320 8.03<br />
4 Approved Investments 304977 29.58 385107 31.79<br />
5 Other Investments 42159 4.09 46262 3.82<br />
A. Total (1+2+3+4+5) 1031002 100.00 1211287 100.00<br />
ULIP Funds<br />
6 Approved Investments 371899 93.18 346340 93.61<br />
7 Other Investments 27217 6.82 23632 6.39<br />
B. Total (6+7) 399116 100.00 369972 100.00<br />
Grand Total (A+B) 1430118 1581259<br />
Note: The fi gures for 2011-12 are based on Provisional Returns fi led with <strong>IRDA</strong>.<br />
I.4.5.4 The pattern of investments made by life insurers<br />
remained unchanged as on 31 st March, 2012 when<br />
compared to 31 st March, 2011. Central Government<br />
Securities and Approved Investments continue to be<br />
the two major avenues of investments by life insurers.<br />
I.4.5.5 Segregated on the fund basis, it was observed<br />
that Life Fund contributed `9,74,620 crore (61.64 per<br />
cent), Pension and General Annuity & Group Fund<br />
`2,36,667 crore (14.96 per cent) and ULIP Fund<br />
`3,69,972 crore (23.40 per cent) in total investments.<br />
During 2011-12, the share of Pension/Annuity Funds<br />
in total investment increased from 13.28 per cent to<br />
14.97 per cent. Similarly, the share of Life Funds<br />
increased from 58.81 per cent to 61.64 per cent. In<br />
TABLE I.44<br />
INVESTMENTS OF LIFE INSURERS : FUND-WISE<br />
(As on 31 st March)<br />
Insurer Life Fund Pension and General<br />
Annuity & Group Fund<br />
Unit Linked Fund<br />
(` crore)<br />
Total of all Funds<br />
2011 2012 2011 2012 2011 2012 2011 2012<br />
LIC 798291 914614 173282 212754 177016 141703 1148589 1269070<br />
Private 42784 60006 16646 23913 222099 228269 281528 312188<br />
Total 841075 974620 189927 236667 399116 369972 1430118 1581259<br />
(58.81) (61.64) (13.28) (14.97) (27.91) (23.40) (100.00) (100.00)<br />
Note: 1. The fi gures for 2011-12 are based on Provisional Returns fi led with <strong>IRDA</strong>.<br />
2. The fi gures in brackets are percentage of respective funds to the total funds.<br />
60