Download PDF - IRDA
Download PDF - IRDA
Download PDF - IRDA

You also want an ePaper? Increase the reach of your titles
YUMPU automatically turns print PDFs into web optimized ePapers that Google loves.
ANNUAL REPORT 2011-12<br />
This alone accounted for 57 per cent of global<br />
economic losses and contributed to an overall high<br />
figure of economic losses (both insured and uninsured).<br />
The total economic losses to society due to disasters<br />
(both insured and uninsured) reached to an estimated<br />
USD 370 billion in 2011, which appeared to be a<br />
signifi cantly larger amount, as compared to USD 226<br />
billion recorded in 2010. The higher claims led to the<br />
profi tability of the non-life insurance industry being<br />
under pressure. Further, relatively lower interest rate<br />
environment, which prevailed in 2011, put further<br />
pressure on the non-life insurance companies to<br />
generate adequate returns from investment activities.<br />
Indian Insurance in the global scenario<br />
I.2.7 In the life insurance business, India ranked 10 th<br />
among the 156 countries, for which the data is<br />
published by Swiss Re. During 2011-12, the life<br />
insurance premium in India declined by 8.5 per cent<br />
(inflation adjusted). During the same period, the global<br />
life insurance premium declined by 2.7 per cent. The<br />
share of Indian life insurance sector in global life<br />
insurance market stood at 2.30 per cent during 2011,<br />
as against 2.54 per cent in 2010.<br />
I.2.8 The non-life insurance sector witnessed a<br />
significant growth of 13.5 per cent during 2011-12. Its<br />
performance is far better when compared to global<br />
non-life premium, which expanded by a meager 1.8<br />
per cent during the same period. The share of Indian<br />
non-life insurance premium in global non-life insurance<br />
premium increased slightly from 0.57 per cent in 2010-<br />
11 to 0.62 per cent in the year 2011-12. India stood at<br />
19 th rank in global non-life premium income.<br />
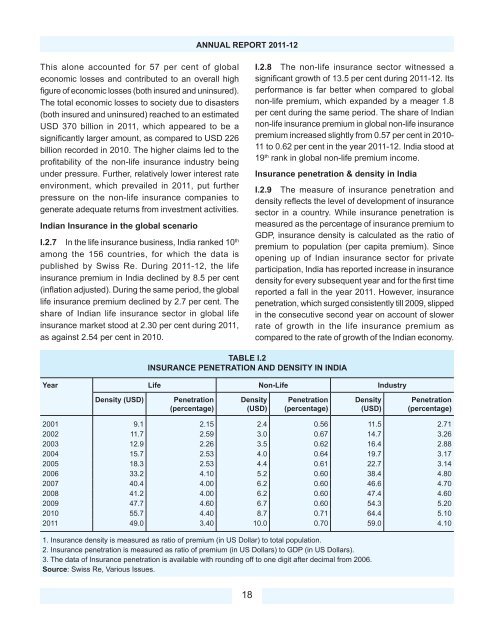
Insurance penetration & density in India<br />
I.2.9 The measure of insurance penetration and<br />
density refl ects the level of development of insurance<br />
sector in a country. While insurance penetration is<br />
measured as the percentage of insurance premium to<br />
GDP, insurance density is calculated as the ratio of<br />
premium to population (per capita premium). Since<br />
opening up of Indian insurance sector for private<br />
participation, India has reported increase in insurance<br />
density for every subsequent year and for the first time<br />
reported a fall in the year 2011. However, insurance<br />
penetration, which surged consistently till 2009, slipped<br />
in the consecutive second year on account of slower<br />
rate of growth in the life insurance premium as<br />
compared to the rate of growth of the Indian economy.<br />
TABLE I.2<br />
INSURANCE PENETRATION AND DENSITY IN INDIA<br />
Year Life Non-Life Industry<br />
Density (USD)<br />
Penetration<br />
(percentage)<br />
Density<br />
(USD)<br />
Penetration<br />
(percentage)<br />
Density<br />
(USD)<br />
Penetration<br />
(percentage)<br />
2001 9.1 2.15 2.4 0.56 11.5 2.71<br />
2002 11.7 2.59 3.0 0.67 14.7 3.26<br />
2003 12.9 2.26 3.5 0.62 16.4 2.88<br />
2004 15.7 2.53 4.0 0.64 19.7 3.17<br />
2005 18.3 2.53 4.4 0.61 22.7 3.14<br />
2006 33.2 4.10 5.2 0.60 38.4 4.80<br />
2007 40.4 4.00 6.2 0.60 46.6 4.70<br />
2008 41.2 4.00 6.2 0.60 47.4 4.60<br />
2009 47.7 4.60 6.7 0.60 54.3 5.20<br />
2010 55.7 4.40 8.7 0.71 64.4 5.10<br />
2011 49.0 3.40 10.0 0.70 59.0 4.10<br />
1. Insurance density is measured as ratio of premium (in US Dollar) to total population.<br />
2. Insurance penetration is measured as ratio of premium (in US Dollars) to GDP (in US Dollars).<br />
3. The data of Insurance penetration is available with rounding off to one digit after decimal from 2006.<br />
Source: Swiss Re, Various Issues.<br />
18