X-ray Study of Low-mass Young Stellar Objects in the ρ Ophiuchi ...
X-ray Study of Low-mass Young Stellar Objects in the ρ Ophiuchi ...
X-ray Study of Low-mass Young Stellar Objects in the ρ Ophiuchi ...
You also want an ePaper? Increase the reach of your titles
YUMPU automatically turns print PDFs into web optimized ePapers that Google loves.
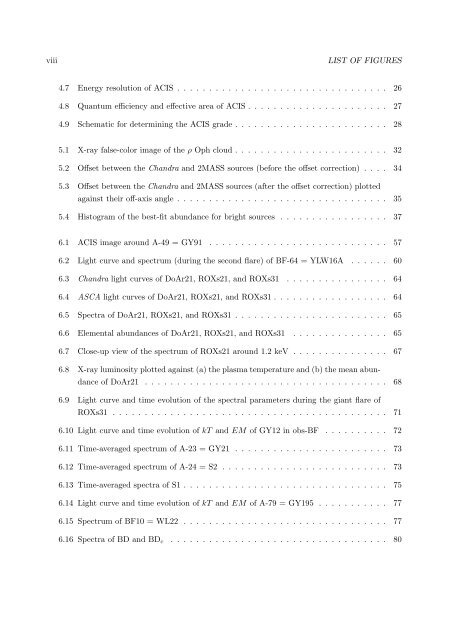
viiiLIST OF FIGURES4.7 Energy resolution <strong>of</strong> ACIS . . . . . . . . . . . . . . . . . . . . . . . . . . . . . . . . . 264.8 Quantum efficiency and effective area <strong>of</strong> ACIS . . . . . . . . . . . . . . . . . . . . . . 274.9 Schematic for determ<strong>in</strong><strong>in</strong>g <strong>the</strong> ACIS grade . . . . . . . . . . . . . . . . . . . . . . . . 285.1 X-<strong>ray</strong> false-color image <strong>of</strong> <strong>the</strong> <strong>ρ</strong> Oph cloud . . . . . . . . . . . . . . . . . . . . . . . . 325.2 Offset between <strong>the</strong> Chandra and 2MASS sources (before <strong>the</strong> <strong>of</strong>fset correction) . . . . 345.3 Offset between <strong>the</strong> Chandra and 2MASS sources (after <strong>the</strong> <strong>of</strong>fset correction) plottedaga<strong>in</strong>st <strong>the</strong>ir <strong>of</strong>f-axis angle . . . . . . . . . . . . . . . . . . . . . . . . . . . . . . . . . 355.4 Histogram <strong>of</strong> <strong>the</strong> best-fit abundance for bright sources . . . . . . . . . . . . . . . . . 376.1 ACIS image around A-49 = GY91 . . . . . . . . . . . . . . . . . . . . . . . . . . . . 576.2 Light curve and spectrum (dur<strong>in</strong>g <strong>the</strong> second flare) <strong>of</strong> BF-64 = YLW16A . . . . . . 606.3 Chandra light curves <strong>of</strong> DoAr21, ROXs21, and ROXs31 . . . . . . . . . . . . . . . . 646.4 ASCA light curves <strong>of</strong> DoAr21, ROXs21, and ROXs31 . . . . . . . . . . . . . . . . . . 646.5 Spectra <strong>of</strong> DoAr21, ROXs21, and ROXs31 . . . . . . . . . . . . . . . . . . . . . . . . 656.6 Elemental abundances <strong>of</strong> DoAr21, ROXs21, and ROXs31 . . . . . . . . . . . . . . . 656.7 Close-up view <strong>of</strong> <strong>the</strong> spectrum <strong>of</strong> ROXs21 around 1.2 keV . . . . . . . . . . . . . . . 676.8 X-<strong>ray</strong> lum<strong>in</strong>osity plotted aga<strong>in</strong>st (a) <strong>the</strong> plasma temperature and (b) <strong>the</strong> mean abundance<strong>of</strong> DoAr21 . . . . . . . . . . . . . . . . . . . . . . . . . . . . . . . . . . . . . . 686.9 Light curve and time evolution <strong>of</strong> <strong>the</strong> spectral parameters dur<strong>in</strong>g <strong>the</strong> giant flare <strong>of</strong>ROXs31 . . . . . . . . . . . . . . . . . . . . . . . . . . . . . . . . . . . . . . . . . . . 716.10 Light curve and time evolution <strong>of</strong> kT and EM <strong>of</strong> GY12 <strong>in</strong> obs-BF . . . . . . . . . . 726.11 Time-averaged spectrum <strong>of</strong> A-23 = GY21 . . . . . . . . . . . . . . . . . . . . . . . . 736.12 Time-averaged spectrum <strong>of</strong> A-24 = S2 . . . . . . . . . . . . . . . . . . . . . . . . . . 736.13 Time-averaged spectra <strong>of</strong> S1 . . . . . . . . . . . . . . . . . . . . . . . . . . . . . . . . 756.14 Light curve and time evolution <strong>of</strong> kT and EM <strong>of</strong> A-79 = GY195 . . . . . . . . . . . 776.15 Spectrum <strong>of</strong> BF10 = WL22 . . . . . . . . . . . . . . . . . . . . . . . . . . . . . . . . 776.16 Spectra <strong>of</strong> BD and BD c . . . . . . . . . . . . . . . . . . . . . . . . . . . . . . . . . . 80


