

X-ray Study of Low-mass Young Stellar Objects in the ρ Ophiuchi ...
X-ray Study of Low-mass Young Stellar Objects in the ρ Ophiuchi ...
X-ray Study of Low-mass Young Stellar Objects in the ρ Ophiuchi ...

Create successful ePaper yourself
Turn your PDF publications into a flip-book with our unique Google optimized e-Paper software.
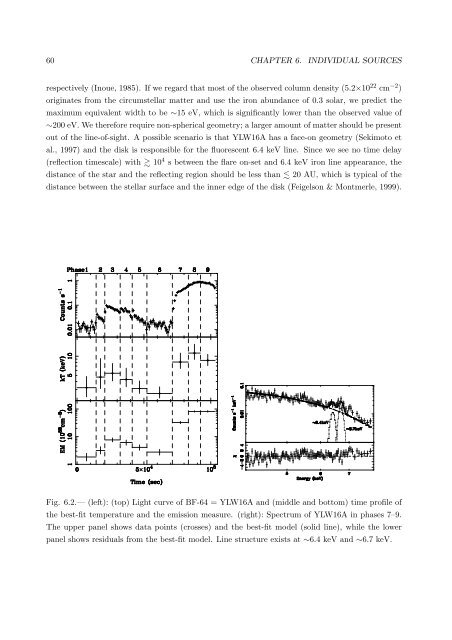
60 CHAPTER 6. INDIVIDUAL SOURCESrespectively (Inoue, 1985). If we regard that most <strong>of</strong> <strong>the</strong> observed column density (5.2×10 22 cm −2 )orig<strong>in</strong>ates from <strong>the</strong> circumstellar matter and use <strong>the</strong> iron abundance <strong>of</strong> 0.3 solar, we predict <strong>the</strong>maximum equivalent width to be ∼15 eV, which is significantly lower than <strong>the</strong> observed value <strong>of</strong>∼200 eV. We <strong>the</strong>refore require non-spherical geometry; a larger amount <strong>of</strong> matter should be presentout <strong>of</strong> <strong>the</strong> l<strong>in</strong>e-<strong>of</strong>-sight. A possible scenario is that YLW16A has a face-on geometry (Sekimoto etal., 1997) and <strong>the</strong> disk is responsible for <strong>the</strong> fluorescent 6.4 keV l<strong>in</strong>e. S<strong>in</strong>ce we see no time delay(reflection timescale) with 10 4 s between <strong>the</strong> flare on-set and 6.4 keV iron l<strong>in</strong>e appearance, <strong>the</strong>distance <strong>of</strong> <strong>the</strong> star and <strong>the</strong> reflect<strong>in</strong>g region should be less than 20 AU, which is typical <strong>of</strong> <strong>the</strong>distance between <strong>the</strong> stellar surface and <strong>the</strong> <strong>in</strong>ner edge <strong>of</strong> <strong>the</strong> disk (Feigelson & Montmerle, 1999).Fig. 6.2.— (left): (top) Light curve <strong>of</strong> BF-64 = YLW16A and (middle and bottom) time pr<strong>of</strong>ile <strong>of</strong><strong>the</strong> best-fit temperature and <strong>the</strong> emission measure. (right): Spectrum <strong>of</strong> YLW16A <strong>in</strong> phases 7–9.The upper panel shows data po<strong>in</strong>ts (crosses) and <strong>the</strong> best-fit model (solid l<strong>in</strong>e), while <strong>the</strong> lowerpanel shows residuals from <strong>the</strong> best-fit model. L<strong>in</strong>e structure exists at ∼6.4 keV and ∼6.7 keV.


