

X-ray Study of Low-mass Young Stellar Objects in the ρ Ophiuchi ...
X-ray Study of Low-mass Young Stellar Objects in the ρ Ophiuchi ...
X-ray Study of Low-mass Young Stellar Objects in the ρ Ophiuchi ...

You also want an ePaper? Increase the reach of your titles
YUMPU automatically turns print PDFs into web optimized ePapers that Google loves.
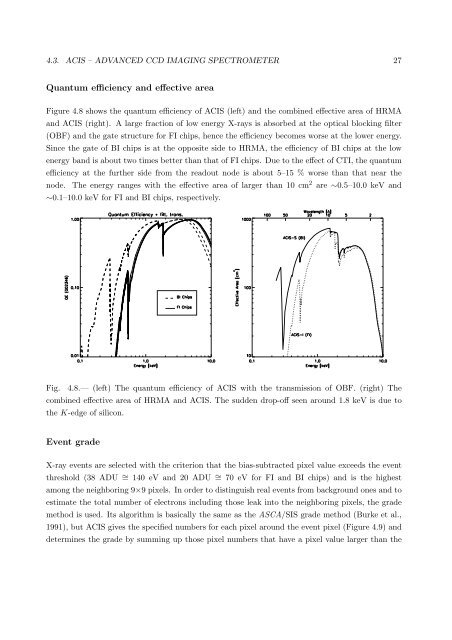
4.3. ACIS – ADVANCED CCD IMAGING SPECTROMETER 27Quantum efficiency and effective areaFigure 4.8 shows <strong>the</strong> quantum efficiency <strong>of</strong> ACIS (left) and <strong>the</strong> comb<strong>in</strong>ed effective area <strong>of</strong> HRMAand ACIS (right). A large fraction <strong>of</strong> low energy X-<strong>ray</strong>s is absorbed at <strong>the</strong> optical block<strong>in</strong>g filter(OBF) and <strong>the</strong> gate structure for FI chips, hence <strong>the</strong> efficiency becomes worse at <strong>the</strong> lower energy.S<strong>in</strong>ce <strong>the</strong> gate <strong>of</strong> BI chips is at <strong>the</strong> opposite side to HRMA, <strong>the</strong> efficiency <strong>of</strong> BI chips at <strong>the</strong> lowenergy band is about two times better than that <strong>of</strong> FI chips. Due to <strong>the</strong> effect <strong>of</strong> CTI, <strong>the</strong> quantumefficiency at <strong>the</strong> fur<strong>the</strong>r side from <strong>the</strong> readout node is about 5–15 % worse than that near <strong>the</strong>node. The energy ranges with <strong>the</strong> effective area <strong>of</strong> larger than 10 cm 2 are ∼0.5–10.0 keV and∼0.1–10.0 keV for FI and BI chips, respectively.Fig. 4.8.— (left) The quantum efficiency <strong>of</strong> ACIS with <strong>the</strong> transmission <strong>of</strong> OBF. (right) Thecomb<strong>in</strong>ed effective area <strong>of</strong> HRMA and ACIS. The sudden drop-<strong>of</strong>f seen around 1.8 keV is due to<strong>the</strong> K-edge <strong>of</strong> silicon.Event gradeX-<strong>ray</strong> events are selected with <strong>the</strong> criterion that <strong>the</strong> bias-subtracted pixel value exceeds <strong>the</strong> eventthreshold (38 ADU ∼ = 140 eV and 20 ADU ∼ = 70 eV for FI and BI chips) and is <strong>the</strong> highestamong <strong>the</strong> neighbor<strong>in</strong>g 9×9 pixels. In order to dist<strong>in</strong>guish real events from background ones and toestimate <strong>the</strong> total number <strong>of</strong> electrons <strong>in</strong>clud<strong>in</strong>g those leak <strong>in</strong>to <strong>the</strong> neighbor<strong>in</strong>g pixels, <strong>the</strong> grademethod is used. Its algorithm is basically <strong>the</strong> same as <strong>the</strong> ASCA/SIS grade method (Burke et al.,1991), but ACIS gives <strong>the</strong> specified numbers for each pixel around <strong>the</strong> event pixel (Figure 4.9) anddeterm<strong>in</strong>es <strong>the</strong> grade by summ<strong>in</strong>g up those pixel numbers that have a pixel value larger than <strong>the</strong>


