

X-ray Study of Low-mass Young Stellar Objects in the ρ Ophiuchi ...
X-ray Study of Low-mass Young Stellar Objects in the ρ Ophiuchi ...
X-ray Study of Low-mass Young Stellar Objects in the ρ Ophiuchi ...

You also want an ePaper? Increase the reach of your titles
YUMPU automatically turns print PDFs into web optimized ePapers that Google loves.
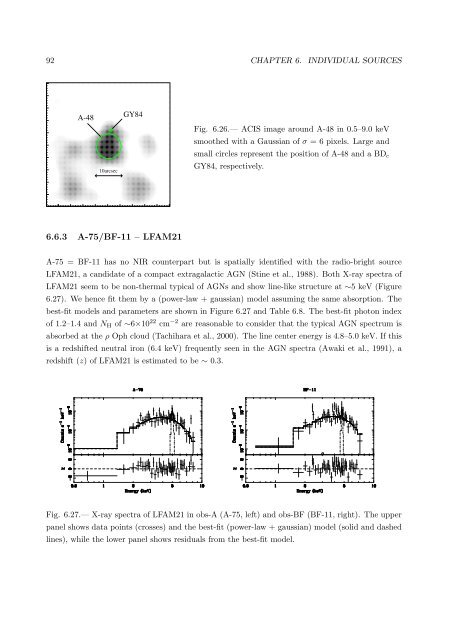
92 CHAPTER 6. INDIVIDUAL SOURCESFig. 6.26.— ACIS image around A-48 <strong>in</strong> 0.5–9.0 keVsmoo<strong>the</strong>d with a Gaussian <strong>of</strong> σ = 6 pixels. Large andsmall circles represent <strong>the</strong> position <strong>of</strong> A-48 and a BD cGY84, respectively.6.6.3 A-75/BF-11 – LFAM21A-75 = BF-11 has no NIR counterpart but is spatially identified with <strong>the</strong> radio-bright sourceLFAM21, a candidate <strong>of</strong> a compact extragalactic AGN (St<strong>in</strong>e et al., 1988). Both X-<strong>ray</strong> spectra <strong>of</strong>LFAM21 seem to be non-<strong>the</strong>rmal typical <strong>of</strong> AGNs and show l<strong>in</strong>e-like structure at ∼5 keV (Figure6.27). We hence fit <strong>the</strong>m by a (power-law + gaussian) model assum<strong>in</strong>g <strong>the</strong> same absorption. Thebest-fit models and parameters are shown <strong>in</strong> Figure 6.27 and Table 6.8. The best-fit photon <strong>in</strong>dex<strong>of</strong> 1.2–1.4 and N H <strong>of</strong> ∼6×10 22 cm −2 are reasonable to consider that <strong>the</strong> typical AGN spectrum isabsorbed at <strong>the</strong> <strong>ρ</strong> Oph cloud (Tachihara et al., 2000). The l<strong>in</strong>e center energy is 4.8–5.0 keV. If thisis a redshifted neutral iron (6.4 keV) frequently seen <strong>in</strong> <strong>the</strong> AGN spectra (Awaki et al., 1991), aredshift (z) <strong>of</strong> LFAM21 is estimated to be ∼ 0.3.Fig. 6.27.— X-<strong>ray</strong> spectra <strong>of</strong> LFAM21 <strong>in</strong> obs-A (A-75, left) and obs-BF (BF-11, right). The upperpanel shows data po<strong>in</strong>ts (crosses) and <strong>the</strong> best-fit (power-law + gaussian) model (solid and dashedl<strong>in</strong>es), while <strong>the</strong> lower panel shows residuals from <strong>the</strong> best-fit model.


