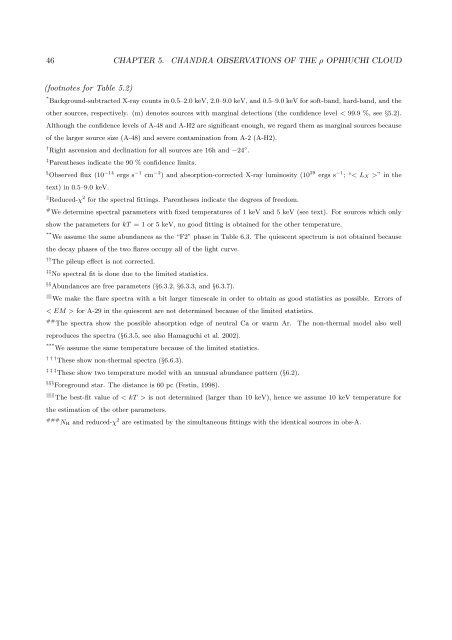
46 CHAPTER 5. CHANDRA OBSERVATIONS OF THE <strong>ρ</strong> OPHIUCHI CLOUD(footnotes for Table 5.2)* Background-subtracted X-<strong>ray</strong> counts <strong>in</strong> 0.5–2.0 keV, 2.0–9.0 keV, and 0.5–9.0 keV for s<strong>of</strong>t-band, hard-band, and <strong>the</strong>o<strong>the</strong>r sources, respectively. (m) denotes sources with marg<strong>in</strong>al detections (<strong>the</strong> confidence level < 99.9 %, see §5.2).Although <strong>the</strong> confidence levels <strong>of</strong> A-48 and A-H2 are significant enough, we regard <strong>the</strong>m as marg<strong>in</strong>al sources because<strong>of</strong> <strong>the</strong> larger source size (A-48) and severe contam<strong>in</strong>ation from A-2 (A-H2).† Right ascension and decl<strong>in</strong>ation for all sources are 16h and −24 ◦ .‡ Paren<strong>the</strong>ses <strong>in</strong>dicate <strong>the</strong> 90 % confidence limits.§ Observed flux (10 −14 ergs s −1 cm −2 ) and absorption-corrected X-<strong>ray</strong> lum<strong>in</strong>osity (10 29 ergs s −1 ; “< L X >” <strong>in</strong> <strong>the</strong>text) <strong>in</strong> 0.5–9.0 keV.‖ Reduced-χ 2 for <strong>the</strong> spectral fitt<strong>in</strong>gs. Paren<strong>the</strong>ses <strong>in</strong>dicate <strong>the</strong> degrees <strong>of</strong> freedom.# We determ<strong>in</strong>e spectral parameters with fixed temperatures <strong>of</strong> 1 keV and 5 keV (see text). For sources which onlyshow <strong>the</strong> parameters for kT = 1 or 5 keV, no good fitt<strong>in</strong>g is obta<strong>in</strong>ed for <strong>the</strong> o<strong>the</strong>r temperature.** We assume <strong>the</strong> same abundances as <strong>the</strong> “F2” phase <strong>in</strong> Table 6.3. The quiescent spectrum is not obta<strong>in</strong>ed because<strong>the</strong> decay phases <strong>of</strong> <strong>the</strong> two flares occupy all <strong>of</strong> <strong>the</strong> light curve.†† The pileup effect is not corrected.‡‡ No spectral fit is done due to <strong>the</strong> limited statistics.§§ Abundances are free parameters (§6.3.2, §6.3.3, and §6.3.7).‖‖ We make <strong>the</strong> flare spectra with a bit larger timescale <strong>in</strong> order to obta<strong>in</strong> as good statistics as possible. Errors <strong>of</strong>< EM > for A-29 <strong>in</strong> <strong>the</strong> quiescent are not determ<strong>in</strong>ed because <strong>of</strong> <strong>the</strong> limited statistics.## The spectra show <strong>the</strong> possible absorption edge <strong>of</strong> neutral Ca or warm Ar. The non-<strong>the</strong>rmal model also wellreproduces <strong>the</strong> spectra (§6.3.5, see also Hamaguchi et al. 2002).*** We assume <strong>the</strong> same temperature because <strong>of</strong> <strong>the</strong> limited statistics.† † † These show non-<strong>the</strong>rmal spectra (§6.6.3).‡ ‡ ‡ These show two temperature model with an unusual abundance pattern (§6.2).§§§ Foreground star. The distance is 60 pc (Fest<strong>in</strong>, 1998).‖‖‖ The best-fit value <strong>of</strong> < kT > is not determ<strong>in</strong>ed (larger than 10 keV), hence we assume 10 keV temperature for<strong>the</strong> estimation <strong>of</strong> <strong>the</strong> o<strong>the</strong>r parameters.### N H and reduced-χ 2 are estimated by <strong>the</strong> simultaneous fitt<strong>in</strong>gs with <strong>the</strong> identical sources <strong>in</strong> obs-A.
5.7. THE CATALOGUE OF X-RAY SOURCES IN <strong>ρ</strong> OPH 475.7.2 Identifications <strong>of</strong> <strong>the</strong> X-<strong>ray</strong> sourcesTable 5.3:: Identifications <strong>of</strong> <strong>the</strong> X-<strong>ray</strong> sourcesNo. Offset * Radio † —- X-<strong>ray</strong> —- ‡ O<strong>the</strong>r names § Class ‖( ′′ ) P SP C HRI ASCA IKTA-1 ... ... ... ... ... ... ... ...A-2 0.33 R8, S7 13 A11 3 ... DoAr21, ROXs8, YLW26, GSS23, IIIElias14, SKS1-5, ISO10A-3 0.40 ... ... ... ... ... ISO13 IIA-4 7.54(R) R9? ... ... ... ... ... ...A-5 0.60 ... 15? A13 ... ... ISO14 IIIA-6 0.23 ... 16 ... ... ... GSS26, CRBR5, SKS1-6, ISO17 IIA-7 ... ... ... ... ... ... ... ...A-8 ... ... ... ... ... ... ... ...A-9 ... ... ... ... ... ... ... ...A-10 ... ... ... ... ... ... ... ...A-11 ... ... ... ... ... ... ... ...A-12 0.47 ... ... ... ... ... CRBR9, SKS1-7, ISO18 III cA-13 ... ... ... ... ... ... ... ...A-14 0.11 Lp1 18 A14 ... ... ROXs11, GSS29, Elias18, CRBR10, IISKS1-8, ISO19A-15 0.44 ... 17 A15 ... ... DoAr24, ROXs10A, GSS28, Elias19, IICRBR11, SKS1-9, ISO20A-16 1.08 ... ... ... ... ... 2MASSI J1626172−241238 ?A-17 ... ... ... ... ... ... ... ...A-18 ... ... ... ... ... ... ... ...A-19 0.38 ... 19 ... ... ... YLW31, VSSG1, Elias20, ISO24 IIA-20 0.03 L2 ... A17 ... ... GY12, VSSG12, ISO34 IIIA-21 ... ... ... ... ... ... ... ...A-22 0.19 ... 24(22?) A18 4 ... ROXs10B, GY20, GSS31, Elias22, IICRBR29, SKS1-15, ISO36A-23 0.23 L3 ... ... ... ... GY21, CRBR30, SKS1-16, ISO37 IIA-24 0.14 ... 25 A19 C3 ... S2, GY23, GSS32, Elias23, CRBR32, IISKS1-17, ISO39A-25 0.15 ... 26 A20 ... ... YLW32, Elias24, ISO40 IIA-26 0.09 ... ... ... ... ... GY31, CRBR34, SKS3-15 ? ‖‖A-27 0.12 ... ... ... ... ... GY29, CRBR35, SKS1-18, ISO41 IIA-28 0.55 ... ... ... ... ... 2MASSI J1626257−241427 ?A-29 ... ... ... ... ... ... ... ...A-30 0.05 ... C15 ... ... ... GY37, VSSG29, CRBR37, ISO42 BD c (III c )A-31 2.66(R) L6? ... ... ... ... ... ...A-32 0.92 ... ... ... ... ... ISO44 III cA-33 0.06 L8 27 ... ... ... SKS1-19, ISO45 IIIA-34 0.72 L9 ... ... ... ... GY51, VSSG27, CRBR38, SKS1-20, IIISO46A-35 ... ... ... ... ... ... ... ...A-36 1.14 ... ... ... ... ... YLW35, GY54, IRS14, ISO47 III cA-37 1.42(R) L10 ... ... ... ... ... ...A-38 0.24 ... ... ... ... ... GY59, CRBR39, SKS1-21 BD cA-39 ... ... ... ... ... ... ... ...A-40 ... ... ... ... ... ... ... ...
- Page 3:
Contents1 Introduction 12 Review of
- Page 9 and 10: List of Figures2.1 The H-R diagram
- Page 11 and 12: LIST OF FIGURESix6.17 Light curves
- Page 13 and 14: List of Tables3.1 Multiwavelength s
- Page 15 and 16: Chapter 1IntroductionStar formation
- Page 17 and 18: Chapter 2Review of Low-mass Young S
- Page 19 and 20: 2.1. EVOLUTION OF LOW-MASS STARS 5w
- Page 21 and 22: 2.2. MOLECULAR CLOUDS 72.2 Molecula
- Page 23 and 24: 2.3. X-RAY OBSERVATIONS OF LOW-MASS
- Page 25 and 26: 2.3. X-RAY OBSERVATIONS OF LOW-MASS
- Page 27: 2.3. X-RAY OBSERVATIONS OF LOW-MASS
- Page 30 and 31: 16 CHAPTER 3. REVIEW OF THE ρ OPHI
- Page 32 and 33: 18 CHAPTER 3. REVIEW OF THE ρ OPHI
- Page 34 and 35: 20 CHAPTER 3. REVIEW OF THE ρ OPHI
- Page 36 and 37: 22 CHAPTER 4. INSTRUMENTATIONrespec
- Page 38 and 39: 24 CHAPTER 4. INSTRUMENTATIONangle
- Page 40 and 41: 26 CHAPTER 4. INSTRUMENTATIONThe AC
- Page 42 and 43: ¨28 CHAPTER 4. INSTRUMENTATIONspli
- Page 44 and 45: 30 CHAPTER 4. INSTRUMENTATIONTable
- Page 46 and 47: 32 CHAPTER 5. CHANDRA OBSERVATIONS
- Page 48 and 49: 34 CHAPTER 5. CHANDRA OBSERVATIONS
- Page 50 and 51: 36 CHAPTER 5. CHANDRA OBSERVATIONS
- Page 52 and 53: 38 CHAPTER 5. CHANDRA OBSERVATIONS
- Page 54 and 55: 40 CHAPTER 5. CHANDRA OBSERVATIONS
- Page 56 and 57: 42 CHAPTER 5. CHANDRA OBSERVATIONS
- Page 58 and 59: 44 CHAPTER 5. CHANDRA OBSERVATIONS
- Page 62 and 63: 48 CHAPTER 5. CHANDRA OBSERVATIONS
- Page 64 and 65: 50 CHAPTER 5. CHANDRA OBSERVATIONS
- Page 66 and 67: 52 CHAPTER 5. CHANDRA OBSERVATIONS
- Page 68 and 69: 54 CHAPTER 5. CHANDRA OBSERVATIONS
- Page 70 and 71: 56 CHAPTER 5. CHANDRA OBSERVATIONS
- Page 72 and 73: 58 CHAPTER 6. INDIVIDUAL SOURCEShig
- Page 74 and 75: 60 CHAPTER 6. INDIVIDUAL SOURCESres
- Page 76 and 77: 62 CHAPTER 6. INDIVIDUAL SOURCES6.2
- Page 78 and 79: 64 CHAPTER 6. INDIVIDUAL SOURCESfla
- Page 80 and 81: 66 CHAPTER 6. INDIVIDUAL SOURCESTab
- Page 82 and 83: 68 CHAPTER 6. INDIVIDUAL SOURCESUsi
- Page 84 and 85: 70 CHAPTER 6. INDIVIDUAL SOURCESlos
- Page 86 and 87: 72 CHAPTER 6. INDIVIDUAL SOURCES6.3
- Page 88 and 89: 74 CHAPTER 6. INDIVIDUAL SOURCESdes
- Page 90 and 91: 76 CHAPTER 6. INDIVIDUAL SOURCESocc
- Page 92 and 93: 78 CHAPTER 6. INDIVIDUAL SOURCES6.4
- Page 94 and 95: 80 CHAPTER 6. INDIVIDUAL SOURCES6.4
- Page 96 and 97: 82 CHAPTER 6. INDIVIDUAL SOURCES6.5
- Page 98 and 99: 84 CHAPTER 6. INDIVIDUAL SOURCES6.5
- Page 100 and 101: 86 CHAPTER 6. INDIVIDUAL SOURCEStha
- Page 102 and 103: 88 CHAPTER 6. INDIVIDUAL SOURCES1ke
- Page 104 and 105: 90 CHAPTER 6. INDIVIDUAL SOURCESThe
- Page 106 and 107: 92 CHAPTER 6. INDIVIDUAL SOURCESFig
- Page 108 and 109: 94 CHAPTER 6. INDIVIDUAL SOURCESPra
- Page 110 and 111:
96 CHAPTER 7. OVERALL FEATURE OF X-
- Page 112 and 113:
98 CHAPTER 7. OVERALL FEATURE OF X-
- Page 114 and 115:
100 CHAPTER 7. OVERALL FEATURE OF X
- Page 116 and 117:
102 CHAPTER 7. OVERALL FEATURE OF X
- Page 118 and 119:
104 CHAPTER 7. OVERALL FEATURE OF X
- Page 121 and 122:
Chapter 8Systematic Study of YSO Fl
- Page 123 and 124:
8.2. CORRELATION BETWEEN THE FLARE
- Page 125 and 126:
8.3. MAGNETIC RECONNECTION MODEL 11
- Page 127 and 128:
8.5. EFFECT OF THE QUIESCENT X-RAYS
- Page 129 and 130:
8.6. EVOLUTION OF YSOS AND THEIR FL
- Page 131 and 132:
Chapter 9ConclusionWe summarize the
- Page 133 and 134:
Appendix AFlare Light CurvesFig. A.
- Page 135 and 136:
Fig.A.2 (Continued)121
- Page 137:
Fig. A.4.— Same as Figure A.1, bu
- Page 140 and 141:
126 APPENDIX B. PHYSICAL PARAMETERS
- Page 142 and 143:
128 APPENDIX B. PHYSICAL PARAMETERS
- Page 145 and 146:
Appendix CModeling of the FlareIn t
- Page 147 and 148:
C.2. PREDICTED CORRELATIONS BETWEEN
- Page 149 and 150:
BibliographyAgeorges, N., Eckart, A
- Page 151 and 152:
BIBLIOGRAPHY 137Feigelson, E. D., &
- Page 153 and 154:
BIBLIOGRAPHY 139Johnstone, D., Wils
- Page 155 and 156:
BIBLIOGRAPHY 141Rutledge, R. E., Ba
- Page 157:
BIBLIOGRAPHY 143Yokoyama, T. & Shib


