

X-ray Study of Low-mass Young Stellar Objects in the ρ Ophiuchi ...
X-ray Study of Low-mass Young Stellar Objects in the ρ Ophiuchi ...
X-ray Study of Low-mass Young Stellar Objects in the ρ Ophiuchi ...

Create successful ePaper yourself
Turn your PDF publications into a flip-book with our unique Google optimized e-Paper software.
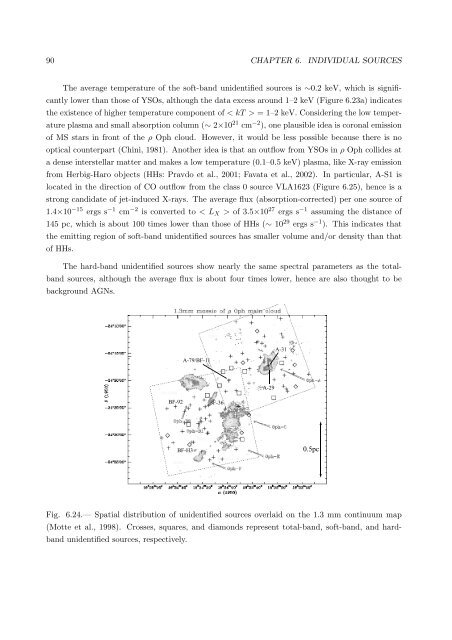
90 CHAPTER 6. INDIVIDUAL SOURCESThe average temperature <strong>of</strong> <strong>the</strong> s<strong>of</strong>t-band unidentified sources is ∼0.2 keV, which is significantlylower than those <strong>of</strong> YSOs, although <strong>the</strong> data excess around 1–2 keV (Figure 6.23a) <strong>in</strong>dicates<strong>the</strong> existence <strong>of</strong> higher temperature component <strong>of</strong> < kT > = 1–2 keV. Consider<strong>in</strong>g <strong>the</strong> low temperatureplasma and small absorption column (∼ 2×10 21 cm −2 ), one plausible idea is coronal emission<strong>of</strong> MS stars <strong>in</strong> front <strong>of</strong> <strong>the</strong> <strong>ρ</strong> Oph cloud. However, it would be less possible because <strong>the</strong>re is nooptical counterpart (Ch<strong>in</strong>i, 1981). Ano<strong>the</strong>r idea is that an outflow from YSOs <strong>in</strong> <strong>ρ</strong> Oph collides ata dense <strong>in</strong>terstellar matter and makes a low temperature (0.1–0.5 keV) plasma, like X-<strong>ray</strong> emissionfrom Herbig-Haro objects (HHs: Pravdo et al., 2001; Favata et al., 2002). In particular, A-S1 islocated <strong>in</strong> <strong>the</strong> direction <strong>of</strong> CO outflow from <strong>the</strong> class 0 source VLA1623 (Figure 6.25), hence is astrong candidate <strong>of</strong> jet-<strong>in</strong>duced X-<strong>ray</strong>s. The average flux (absorption-corrected) per one source <strong>of</strong>1.4×10 −15 ergs s −1 cm −2 is converted to < L X > <strong>of</strong> 3.5×10 27 ergs s −1 assum<strong>in</strong>g <strong>the</strong> distance <strong>of</strong>145 pc, which is about 100 times lower than those <strong>of</strong> HHs (∼ 10 29 ergs s −1 ). This <strong>in</strong>dicates that<strong>the</strong> emitt<strong>in</strong>g region <strong>of</strong> s<strong>of</strong>t-band unidentified sources has smaller volume and/or density than that<strong>of</strong> HHs.The hard-band unidentified sources show nearly <strong>the</strong> same spectral parameters as <strong>the</strong> totalbandsources, although <strong>the</strong> average flux is about four times lower, hence are also thought to bebackground AGNs.Fig. 6.24.— Spatial distribution <strong>of</strong> unidentified sources overlaid on <strong>the</strong> 1.3 mm cont<strong>in</strong>uum map(Motte et al., 1998). Crosses, squares, and diamonds represent total-band, s<strong>of</strong>t-band, and hardbandunidentified sources, respectively.


