

X-ray Study of Low-mass Young Stellar Objects in the ρ Ophiuchi ...
X-ray Study of Low-mass Young Stellar Objects in the ρ Ophiuchi ...
X-ray Study of Low-mass Young Stellar Objects in the ρ Ophiuchi ...

Create successful ePaper yourself
Turn your PDF publications into a flip-book with our unique Google optimized e-Paper software.
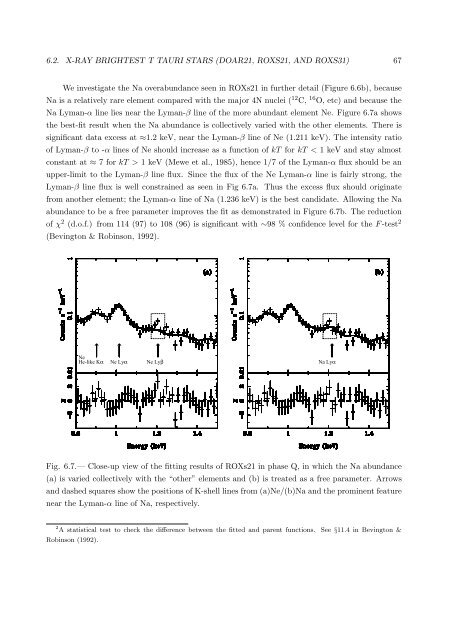
6.2. X-RAY BRIGHTEST T TAURI STARS (DOAR21, ROXS21, AND ROXS31) 67We <strong>in</strong>vestigate <strong>the</strong> Na overabundance seen <strong>in</strong> ROXs21 <strong>in</strong> fur<strong>the</strong>r detail (Figure 6.6b), becauseNa is a relatively rare element compared with <strong>the</strong> major 4N nuclei ( 12 C, 16 O, etc) and because <strong>the</strong>Na Lyman-α l<strong>in</strong>e lies near <strong>the</strong> Lyman-β l<strong>in</strong>e <strong>of</strong> <strong>the</strong> more abundant element Ne. Figure 6.7a shows<strong>the</strong> best-fit result when <strong>the</strong> Na abundance is collectively varied with <strong>the</strong> o<strong>the</strong>r elements. There issignificant data excess at ≈1.2 keV, near <strong>the</strong> Lyman-β l<strong>in</strong>e <strong>of</strong> Ne (1.211 keV). The <strong>in</strong>tensity ratio<strong>of</strong> Lyman-β to -α l<strong>in</strong>es <strong>of</strong> Ne should <strong>in</strong>crease as a function <strong>of</strong> kT for kT < 1 keV and stay almostconstant at ≈ 7 for kT > 1 keV (Mewe et al., 1985), hence 1/7 <strong>of</strong> <strong>the</strong> Lyman-α flux should be anupper-limit to <strong>the</strong> Lyman-β l<strong>in</strong>e flux. S<strong>in</strong>ce <strong>the</strong> flux <strong>of</strong> <strong>the</strong> Ne Lyman-α l<strong>in</strong>e is fairly strong, <strong>the</strong>Lyman-β l<strong>in</strong>e flux is well constra<strong>in</strong>ed as seen <strong>in</strong> Fig 6.7a. Thus <strong>the</strong> excess flux should orig<strong>in</strong>atefrom ano<strong>the</strong>r element; <strong>the</strong> Lyman-α l<strong>in</strong>e <strong>of</strong> Na (1.236 keV) is <strong>the</strong> best candidate. Allow<strong>in</strong>g <strong>the</strong> Naabundance to be a free parameter improves <strong>the</strong> fit as demonstrated <strong>in</strong> Figure 6.7b. The reduction<strong>of</strong> χ 2 (d.o.f.) from 114 (97) to 108 (96) is significant with ∼98 % confidence level for <strong>the</strong> F -test 2(Bev<strong>in</strong>gton & Rob<strong>in</strong>son, 1992).NeHe-like Kα Ne Lyα Ne Lyβ Na LyαFig. 6.7.— Close-up view <strong>of</strong> <strong>the</strong> fitt<strong>in</strong>g results <strong>of</strong> ROXs21 <strong>in</strong> phase Q, <strong>in</strong> which <strong>the</strong> Na abundance(a) is varied collectively with <strong>the</strong> “o<strong>the</strong>r” elements and (b) is treated as a free parameter. Arrowsand dashed squares show <strong>the</strong> positions <strong>of</strong> K-shell l<strong>in</strong>es from (a)Ne/(b)Na and <strong>the</strong> prom<strong>in</strong>ent featurenear <strong>the</strong> Lyman-α l<strong>in</strong>e <strong>of</strong> Na, respectively.2 A statistical test to check <strong>the</strong> difference between <strong>the</strong> fitted and parent functions. See §11.4 <strong>in</strong> Bev<strong>in</strong>gton &Rob<strong>in</strong>son (1992).


