

X-ray Study of Low-mass Young Stellar Objects in the ρ Ophiuchi ...
X-ray Study of Low-mass Young Stellar Objects in the ρ Ophiuchi ...
X-ray Study of Low-mass Young Stellar Objects in the ρ Ophiuchi ...

You also want an ePaper? Increase the reach of your titles
YUMPU automatically turns print PDFs into web optimized ePapers that Google loves.
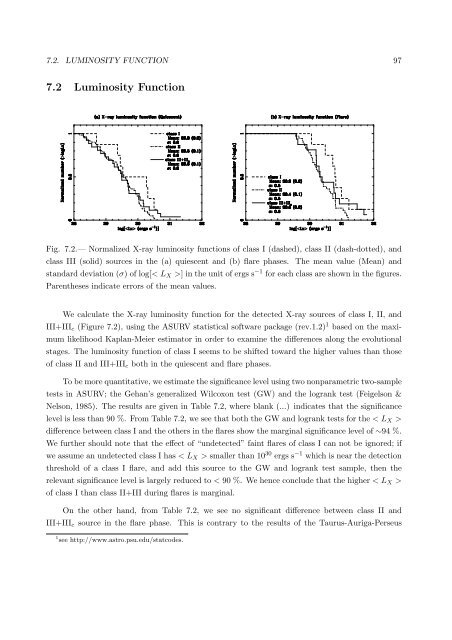
7.2. LUMINOSITY FUNCTION 977.2 Lum<strong>in</strong>osity FunctionFig. 7.2.— Normalized X-<strong>ray</strong> lum<strong>in</strong>osity functions <strong>of</strong> class I (dashed), class II (dash-dotted), andclass III (solid) sources <strong>in</strong> <strong>the</strong> (a) quiescent and (b) flare phases. The mean value (Mean) andstandard deviation (σ) <strong>of</strong> log[< L X >] <strong>in</strong> <strong>the</strong> unit <strong>of</strong> ergs s −1 for each class are shown <strong>in</strong> <strong>the</strong> figures.Paren<strong>the</strong>ses <strong>in</strong>dicate errors <strong>of</strong> <strong>the</strong> mean values.We calculate <strong>the</strong> X-<strong>ray</strong> lum<strong>in</strong>osity function for <strong>the</strong> detected X-<strong>ray</strong> sources <strong>of</strong> class I, II, andIII+III c (Figure 7.2), us<strong>in</strong>g <strong>the</strong> ASURV statistical s<strong>of</strong>tware package (rev.1.2) 1 based on <strong>the</strong> maximumlikelihood Kaplan-Meier estimator <strong>in</strong> order to exam<strong>in</strong>e <strong>the</strong> differences along <strong>the</strong> evolutionalstages. The lum<strong>in</strong>osity function <strong>of</strong> class I seems to be shifted toward <strong>the</strong> higher values than those<strong>of</strong> class II and III+III c both <strong>in</strong> <strong>the</strong> quiescent and flare phases.To be more quantitative, we estimate <strong>the</strong> significance level us<strong>in</strong>g two nonparametric two-sampletests <strong>in</strong> ASURV; <strong>the</strong> Gehan’s generalized Wilcoxon test (GW) and <strong>the</strong> logrank test (Feigelson &Nelson, 1985). The results are given <strong>in</strong> Table 7.2, where blank (...) <strong>in</strong>dicates that <strong>the</strong> significancelevel is less than 90 %. From Table 7.2, we see that both <strong>the</strong> GW and logrank tests for <strong>the</strong> < L X >difference between class I and <strong>the</strong> o<strong>the</strong>rs <strong>in</strong> <strong>the</strong> flares show <strong>the</strong> marg<strong>in</strong>al significance level <strong>of</strong> ∼94 %.We fur<strong>the</strong>r should note that <strong>the</strong> effect <strong>of</strong> “undetected” fa<strong>in</strong>t flares <strong>of</strong> class I can not be ignored; ifwe assume an undetected class I has < L X > smaller than 10 30 ergs s −1 which is near <strong>the</strong> detectionthreshold <strong>of</strong> a class I flare, and add this source to <strong>the</strong> GW and logrank test sample, <strong>the</strong>n <strong>the</strong>relevant significance level is largely reduced to < 90 %. We hence conclude that <strong>the</strong> higher < L X ><strong>of</strong> class I than class II+III dur<strong>in</strong>g flares is marg<strong>in</strong>al.On <strong>the</strong> o<strong>the</strong>r hand, from Table 7.2, we see no significant difference between class II andIII+III c source <strong>in</strong> <strong>the</strong> flare phase. This is contrary to <strong>the</strong> results <strong>of</strong> <strong>the</strong> Taurus-Auriga-Perseus1 see http://www.astro.psu.edu/statcodes.


