82 CHAPTER 6. INDIVIDUAL SOURCES6.5 New YSO Candidates – A-29, A-31, and BF-366.5.1 Source selection and X-<strong>ray</strong> imagesImanishi et al. (2001a) suggested that most <strong>of</strong> unidentified sources are likely background activegalactic nuclei (AGNs; see also §6.6). However, some fractions would be IR-fa<strong>in</strong>t cloud members,possibly brown dwarfs and/or very young stellar objects like class 0–I protostars. To search fornew YSO candidates, we select <strong>the</strong> unidentified sources located near 850 µm clumps (Johnstone etal., 2000), <strong>the</strong>n f<strong>in</strong>d three candidates (A-29, A-31, and BF-36: Imanishi et al., 2002b) <strong>in</strong> <strong>the</strong> densemillimeter/sub-millimeter cores <strong>of</strong> SM1/SMM J16264−2424 and SMM J16264−2423 <strong>in</strong> <strong>ρ</strong> Oph-A,and B1-MM4/SMM J16272−2430 <strong>in</strong> <strong>ρ</strong> Oph-B1 (Motte et al., 1998; Johnstone et al., 2000).SMMJ16264-2422b-24:23:30unIDGY31Dec.(J2000)24:0024:3025:00SMMJ16264-2423SMMJ16264-2424A-31SM1KSHK-AA-29VLA1623GY2916:26:32 26:30 26:28 26:26 26:24R.A.(J2000)GY21S2Fig. 6.18.— ACIS images around <strong>the</strong> mm cores (left) SM1 and (right) B1-MM4 <strong>in</strong> <strong>the</strong> 2.0–9.0 keVband. The contour is <strong>the</strong> (left) 3 mm and (right) 1.3 mm radio <strong>in</strong>tensities (Motte et al., 1998;Kamazaki et al., 2001). Crosses, Large solid and dotted circles represent <strong>the</strong> center <strong>of</strong> each mmcore, size <strong>of</strong> 850µm clumps (Johnstone et al., 2000) and field <strong>of</strong> view <strong>of</strong> <strong>the</strong> 3 mm observation,respectively. A square shows <strong>the</strong> position <strong>of</strong> <strong>the</strong> class 0 source VLA 1623. O<strong>the</strong>r X-<strong>ray</strong> sources areknown YSOs (GY21, S2, GY29, GY31, and GY238) and unidentified sources (designated as unID).Figure 6.18 (left) shows <strong>the</strong> ACIS image <strong>of</strong> obs-A around SM1 <strong>in</strong> <strong>the</strong> hard X-<strong>ray</strong> band (2.0–9.0 keV), which is overlaid on a 3 mm contour map (Kamazaki et al., 2001). Large circles represent<strong>the</strong> 850 µm clumps (Johnstone et al., 2000). We see two po<strong>in</strong>t-like sources (A-29 and A-31) near<strong>the</strong> center <strong>of</strong> <strong>the</strong> 850 µm clump SMM J16264−2424 and at only ∼2 ′′ away from <strong>the</strong> center <strong>of</strong> <strong>the</strong>3 mm core A (hereafter, KSHK-A). S<strong>in</strong>ce <strong>the</strong>re is no significant s<strong>of</strong>t X-<strong>ray</strong> (0.5–2.0 keV) from A-29and A-31, <strong>the</strong>y are deeply embedded <strong>in</strong> <strong>the</strong> cores. Ano<strong>the</strong>r po<strong>in</strong>t source located near <strong>the</strong> core,a class II source GY29 (A-27), on <strong>the</strong> o<strong>the</strong>r hand, is clearly visible <strong>in</strong> <strong>the</strong> s<strong>of</strong>t band because <strong>of</strong>
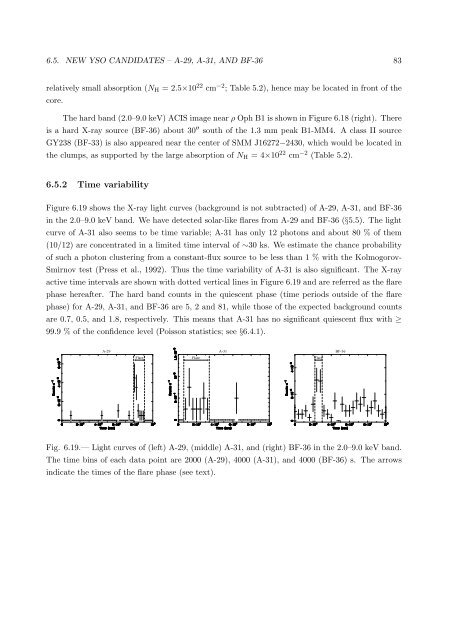
6.5. NEW YSO CANDIDATES – A-29, A-31, AND BF-36 83relatively small absorption (N H = 2.5×10 22 cm −2 ; Table 5.2), hence may be located <strong>in</strong> front <strong>of</strong> <strong>the</strong>core.The hard band (2.0–9.0 keV) ACIS image near <strong>ρ</strong> Oph B1 is shown <strong>in</strong> Figure 6.18 (right). Thereis a hard X-<strong>ray</strong> source (BF-36) about 30 ′′ south <strong>of</strong> <strong>the</strong> 1.3 mm peak B1-MM4. A class II sourceGY238 (BF-33) is also appeared near <strong>the</strong> center <strong>of</strong> SMM J16272−2430, which would be located <strong>in</strong><strong>the</strong> clumps, as supported by <strong>the</strong> large absorption <strong>of</strong> N H = 4×10 22 cm −2 (Table 5.2).6.5.2 Time variabilityFigure 6.19 shows <strong>the</strong> X-<strong>ray</strong> light curves (background is not subtracted) <strong>of</strong> A-29, A-31, and BF-36<strong>in</strong> <strong>the</strong> 2.0–9.0 keV band. We have detected solar-like flares from A-29 and BF-36 (§5.5). The lightcurve <strong>of</strong> A-31 also seems to be time variable; A-31 has only 12 photons and about 80 % <strong>of</strong> <strong>the</strong>m(10/12) are concentrated <strong>in</strong> a limited time <strong>in</strong>terval <strong>of</strong> ∼30 ks. We estimate <strong>the</strong> chance probability<strong>of</strong> such a photon cluster<strong>in</strong>g from a constant-flux source to be less than 1 % with <strong>the</strong> Kolmogorov-Smirnov test (Press et al., 1992). Thus <strong>the</strong> time variability <strong>of</strong> A-31 is also significant. The X-<strong>ray</strong>active time <strong>in</strong>tervals are shown with dotted vertical l<strong>in</strong>es <strong>in</strong> Figure 6.19 and are referred as <strong>the</strong> flarephase hereafter. The hard band counts <strong>in</strong> <strong>the</strong> quiescent phase (time periods outside <strong>of</strong> <strong>the</strong> flarephase) for A-29, A-31, and BF-36 are 5, 2 and 81, while those <strong>of</strong> <strong>the</strong> expected background countsare 0.7, 0.5, and 1.8, respectively. This means that A-31 has no significant quiescent flux with ≥99.9 % <strong>of</strong> <strong>the</strong> confidence level (Poisson statistics; see §6.4.1).A-29FlareFlareA-31FlareBF-36Fig. 6.19.— Light curves <strong>of</strong> (left) A-29, (middle) A-31, and (right) BF-36 <strong>in</strong> <strong>the</strong> 2.0–9.0 keV band.The time b<strong>in</strong>s <strong>of</strong> each data po<strong>in</strong>t are 2000 (A-29), 4000 (A-31), and 4000 (BF-36) s. The arrows<strong>in</strong>dicate <strong>the</strong> times <strong>of</strong> <strong>the</strong> flare phase (see text).
- Page 3:
Contents1 Introduction 12 Review of
- Page 9 and 10:
List of Figures2.1 The H-R diagram
- Page 11 and 12:
LIST OF FIGURESix6.17 Light curves
- Page 13 and 14:
List of Tables3.1 Multiwavelength s
- Page 15 and 16:
Chapter 1IntroductionStar formation
- Page 17 and 18:
Chapter 2Review of Low-mass Young S
- Page 19 and 20:
2.1. EVOLUTION OF LOW-MASS STARS 5w
- Page 21 and 22:
2.2. MOLECULAR CLOUDS 72.2 Molecula
- Page 23 and 24:
2.3. X-RAY OBSERVATIONS OF LOW-MASS
- Page 25 and 26:
2.3. X-RAY OBSERVATIONS OF LOW-MASS
- Page 27:
2.3. X-RAY OBSERVATIONS OF LOW-MASS
- Page 30 and 31:
16 CHAPTER 3. REVIEW OF THE ρ OPHI
- Page 32 and 33:
18 CHAPTER 3. REVIEW OF THE ρ OPHI
- Page 34 and 35:
20 CHAPTER 3. REVIEW OF THE ρ OPHI
- Page 36 and 37:
22 CHAPTER 4. INSTRUMENTATIONrespec
- Page 38 and 39:
24 CHAPTER 4. INSTRUMENTATIONangle
- Page 40 and 41:
26 CHAPTER 4. INSTRUMENTATIONThe AC
- Page 42 and 43:
¨28 CHAPTER 4. INSTRUMENTATIONspli
- Page 44 and 45:
30 CHAPTER 4. INSTRUMENTATIONTable
- Page 46 and 47: 32 CHAPTER 5. CHANDRA OBSERVATIONS
- Page 48 and 49: 34 CHAPTER 5. CHANDRA OBSERVATIONS
- Page 50 and 51: 36 CHAPTER 5. CHANDRA OBSERVATIONS
- Page 52 and 53: 38 CHAPTER 5. CHANDRA OBSERVATIONS
- Page 54 and 55: 40 CHAPTER 5. CHANDRA OBSERVATIONS
- Page 56 and 57: 42 CHAPTER 5. CHANDRA OBSERVATIONS
- Page 58 and 59: 44 CHAPTER 5. CHANDRA OBSERVATIONS
- Page 60 and 61: 46 CHAPTER 5. CHANDRA OBSERVATIONS
- Page 62 and 63: 48 CHAPTER 5. CHANDRA OBSERVATIONS
- Page 64 and 65: 50 CHAPTER 5. CHANDRA OBSERVATIONS
- Page 66 and 67: 52 CHAPTER 5. CHANDRA OBSERVATIONS
- Page 68 and 69: 54 CHAPTER 5. CHANDRA OBSERVATIONS
- Page 70 and 71: 56 CHAPTER 5. CHANDRA OBSERVATIONS
- Page 72 and 73: 58 CHAPTER 6. INDIVIDUAL SOURCEShig
- Page 74 and 75: 60 CHAPTER 6. INDIVIDUAL SOURCESres
- Page 76 and 77: 62 CHAPTER 6. INDIVIDUAL SOURCES6.2
- Page 78 and 79: 64 CHAPTER 6. INDIVIDUAL SOURCESfla
- Page 80 and 81: 66 CHAPTER 6. INDIVIDUAL SOURCESTab
- Page 82 and 83: 68 CHAPTER 6. INDIVIDUAL SOURCESUsi
- Page 84 and 85: 70 CHAPTER 6. INDIVIDUAL SOURCESlos
- Page 86 and 87: 72 CHAPTER 6. INDIVIDUAL SOURCES6.3
- Page 88 and 89: 74 CHAPTER 6. INDIVIDUAL SOURCESdes
- Page 90 and 91: 76 CHAPTER 6. INDIVIDUAL SOURCESocc
- Page 92 and 93: 78 CHAPTER 6. INDIVIDUAL SOURCES6.4
- Page 94 and 95: 80 CHAPTER 6. INDIVIDUAL SOURCES6.4
- Page 98 and 99: 84 CHAPTER 6. INDIVIDUAL SOURCES6.5
- Page 100 and 101: 86 CHAPTER 6. INDIVIDUAL SOURCEStha
- Page 102 and 103: 88 CHAPTER 6. INDIVIDUAL SOURCES1ke
- Page 104 and 105: 90 CHAPTER 6. INDIVIDUAL SOURCESThe
- Page 106 and 107: 92 CHAPTER 6. INDIVIDUAL SOURCESFig
- Page 108 and 109: 94 CHAPTER 6. INDIVIDUAL SOURCESPra
- Page 110 and 111: 96 CHAPTER 7. OVERALL FEATURE OF X-
- Page 112 and 113: 98 CHAPTER 7. OVERALL FEATURE OF X-
- Page 114 and 115: 100 CHAPTER 7. OVERALL FEATURE OF X
- Page 116 and 117: 102 CHAPTER 7. OVERALL FEATURE OF X
- Page 118 and 119: 104 CHAPTER 7. OVERALL FEATURE OF X
- Page 121 and 122: Chapter 8Systematic Study of YSO Fl
- Page 123 and 124: 8.2. CORRELATION BETWEEN THE FLARE
- Page 125 and 126: 8.3. MAGNETIC RECONNECTION MODEL 11
- Page 127 and 128: 8.5. EFFECT OF THE QUIESCENT X-RAYS
- Page 129 and 130: 8.6. EVOLUTION OF YSOS AND THEIR FL
- Page 131 and 132: Chapter 9ConclusionWe summarize the
- Page 133 and 134: Appendix AFlare Light CurvesFig. A.
- Page 135 and 136: Fig.A.2 (Continued)121
- Page 137: Fig. A.4.— Same as Figure A.1, bu
- Page 140 and 141: 126 APPENDIX B. PHYSICAL PARAMETERS
- Page 142 and 143: 128 APPENDIX B. PHYSICAL PARAMETERS
- Page 145 and 146: Appendix CModeling of the FlareIn t
- Page 147 and 148:
C.2. PREDICTED CORRELATIONS BETWEEN
- Page 149 and 150:
BibliographyAgeorges, N., Eckart, A
- Page 151 and 152:
BIBLIOGRAPHY 137Feigelson, E. D., &
- Page 153 and 154:
BIBLIOGRAPHY 139Johnstone, D., Wils
- Page 155 and 156:
BIBLIOGRAPHY 141Rutledge, R. E., Ba
- Page 157:
BIBLIOGRAPHY 143Yokoyama, T. & Shib