62 CHAPTER 6. INDIVIDUAL SOURCES6.2 X-<strong>ray</strong> Brightest T Tauri Stars (DoAr21, ROXs21, and ROXs31)Imanishi et al. (2002a) showed <strong>the</strong> Chandra/ACIS and ASCA/GIS results for a series <strong>of</strong> four longtermobservations <strong>of</strong> DoAr21 (A-2), ROXs21 (BF-46) and ROXs31 (BF-96), <strong>the</strong> X-<strong>ray</strong> brightestTTSs <strong>in</strong> <strong>the</strong> <strong>ρ</strong> <strong>Ophiuchi</strong> cloud, <strong>the</strong>n studied <strong>the</strong>ir long-term time variability and detailed structure<strong>of</strong> X-<strong>ray</strong> spectra. Here we show details.6.2.1 Previous knowledgeThe E<strong>in</strong>ste<strong>in</strong> satellite first recognized <strong>the</strong>se sources as bright X-<strong>ray</strong> sources (Montmerle et al.,1983). Subsequent optical observations revealed that <strong>the</strong>y are K–M type stars hav<strong>in</strong>g weak Hαemission (Bouvier & Appenzeller, 1992), which are classified as WTTSs (class III). Simon et al.(1995) observed <strong>the</strong>m by us<strong>in</strong>g <strong>the</strong> lunar occultation <strong>in</strong> <strong>the</strong> <strong>in</strong>frared wavelengths and found thatROXs21 and ROXs31 are b<strong>in</strong>ary systems with separation angles <strong>of</strong> 0. ′′ 3 and 0. ′′ 48, respectively.Shevchenko & Herbst (1998) reported <strong>the</strong> rotation period <strong>of</strong> ROXs21 to be 1.39 days. S<strong>in</strong>ce <strong>the</strong>yshow no cont<strong>in</strong>uum emission at 1.3 mm (André & Montmerle, 1994), <strong>the</strong> circumstellar envelopewould have already disappeared, while DoAr21 may still have an accretion disk as suggested by<strong>the</strong> detection <strong>of</strong> NIR polarized emission (Ageorges et al., 1997). Us<strong>in</strong>g <strong>the</strong> <strong>the</strong>oretical evolutionarytracks <strong>in</strong> <strong>the</strong> H-R diagram, <strong>the</strong> age <strong>of</strong> DoAr21 is estimated to be ∼10 5 yr, which is younger thanthat <strong>of</strong> ROXs21 and ROXs31 (∼10 6 yr: Nürnberger et al., 1998). F<strong>in</strong>ally, DoAr21 and ROXs31show variable centimeter emission, which is probably due to gyro-synchrotron mechanism <strong>in</strong>ducedby surface magnetic field (St<strong>in</strong>e et al., 1988).6.2.2 Long-term observations with Chandra and ASCAWe use <strong>the</strong> data <strong>of</strong> obs-BF for ROXs21 and ROXs31. Although DoAr21 suffers <strong>the</strong> pileup effect <strong>in</strong>obs-A, obs-BF detected X-<strong>ray</strong>s from DoAr21 at <strong>the</strong> ACIS-S2 chip, which mitigates photon pileupbecause <strong>of</strong> <strong>the</strong> large <strong>of</strong>f-axis angle (= large PSF size). We hence use <strong>the</strong> ACIS-S2 data for <strong>the</strong>follow<strong>in</strong>g analysis. The background region for DoAr21 is taken from a source-free 19 arcm<strong>in</strong> 2 regionon ACIS-S2, while that for ROXs21 and ROXs31 is <strong>the</strong> same as used <strong>in</strong> <strong>the</strong> previous analyses.In order to exam<strong>in</strong>e long-term variability and spectral evolution <strong>of</strong> <strong>the</strong>se sources, we additionallyuse <strong>the</strong> previous ASCA observations. Three observations (obs-A1, A2, and A3) were carriedout with <strong>the</strong> two Gas Imag<strong>in</strong>g Spectrometers (GISs: Ohashi et al., 1996) and <strong>the</strong> two Solid-stateImag<strong>in</strong>g Spectrometers (SISs: Burke et al., 1991) onboard ASCA, which are at <strong>the</strong> foci <strong>of</strong> <strong>the</strong> X-<strong>ray</strong>telescopes (XRTs: Serlemitsos et al., 1995) sensitive to photons <strong>in</strong> 0.4–10 keV. However, <strong>the</strong>y wereoutside <strong>of</strong> or at <strong>the</strong> edge <strong>of</strong> <strong>the</strong> SIS’s field <strong>of</strong> view <strong>in</strong> <strong>the</strong> majority <strong>of</strong> <strong>the</strong> observations, hence we use
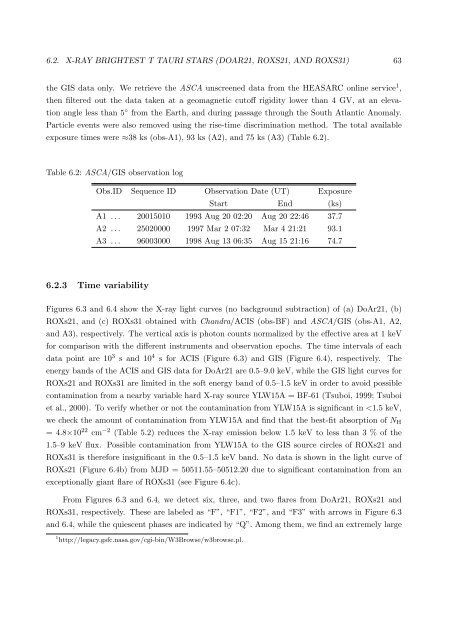
6.2. X-RAY BRIGHTEST T TAURI STARS (DOAR21, ROXS21, AND ROXS31) 63<strong>the</strong> GIS data only. We retrieve <strong>the</strong> ASCA unscreened data from <strong>the</strong> HEASARC onl<strong>in</strong>e service 1 ,<strong>the</strong>n filtered out <strong>the</strong> data taken at a geomagnetic cut<strong>of</strong>f rigidity lower than 4 GV, at an elevationangle less than 5 ◦ from <strong>the</strong> Earth, and dur<strong>in</strong>g passage through <strong>the</strong> South Atlantic Anomaly.Particle events were also removed us<strong>in</strong>g <strong>the</strong> rise-time discrim<strong>in</strong>ation method. The total availableexposure times were ≈38 ks (obs-A1), 93 ks (A2), and 75 ks (A3) (Table 6.2).Table 6.2: ASCA/GIS observation logObs.ID Sequence ID Observation Date (UT) ExposureStart End (ks)A1 . . . 20015010 1993 Aug 20 02:20 Aug 20 22:46 37.7A2 . . . 25020000 1997 Mar 2 07:32 Mar 4 21:21 93.1A3 . . . 96003000 1998 Aug 13 06:35 Aug 15 21:16 74.76.2.3 Time variabilityFigures 6.3 and 6.4 show <strong>the</strong> X-<strong>ray</strong> light curves (no background subtraction) <strong>of</strong> (a) DoAr21, (b)ROXs21, and (c) ROXs31 obta<strong>in</strong>ed with Chandra/ACIS (obs-BF) and ASCA/GIS (obs-A1, A2,and A3), respectively. The vertical axis is photon counts normalized by <strong>the</strong> effective area at 1 keVfor comparison with <strong>the</strong> different <strong>in</strong>struments and observation epochs. The time <strong>in</strong>tervals <strong>of</strong> eachdata po<strong>in</strong>t are 10 3 s and 10 4 s for ACIS (Figure 6.3) and GIS (Figure 6.4), respectively.energy bands <strong>of</strong> <strong>the</strong> ACIS and GIS data for DoAr21 are 0.5–9.0 keV, while <strong>the</strong> GIS light curves forROXs21 and ROXs31 are limited <strong>in</strong> <strong>the</strong> s<strong>of</strong>t energy band <strong>of</strong> 0.5–1.5 keV <strong>in</strong> order to avoid possiblecontam<strong>in</strong>ation from a nearby variable hard X-<strong>ray</strong> source YLW15A = BF-61 (Tsuboi, 1999; Tsuboiet al., 2000). To verify whe<strong>the</strong>r or not <strong>the</strong> contam<strong>in</strong>ation from YLW15A is significant <strong>in</strong>
- Page 3:
Contents1 Introduction 12 Review of
- Page 9 and 10:
List of Figures2.1 The H-R diagram
- Page 11 and 12:
LIST OF FIGURESix6.17 Light curves
- Page 13 and 14:
List of Tables3.1 Multiwavelength s
- Page 15 and 16:
Chapter 1IntroductionStar formation
- Page 17 and 18:
Chapter 2Review of Low-mass Young S
- Page 19 and 20:
2.1. EVOLUTION OF LOW-MASS STARS 5w
- Page 21 and 22:
2.2. MOLECULAR CLOUDS 72.2 Molecula
- Page 23 and 24:
2.3. X-RAY OBSERVATIONS OF LOW-MASS
- Page 25 and 26: 2.3. X-RAY OBSERVATIONS OF LOW-MASS
- Page 27: 2.3. X-RAY OBSERVATIONS OF LOW-MASS
- Page 30 and 31: 16 CHAPTER 3. REVIEW OF THE ρ OPHI
- Page 32 and 33: 18 CHAPTER 3. REVIEW OF THE ρ OPHI
- Page 34 and 35: 20 CHAPTER 3. REVIEW OF THE ρ OPHI
- Page 36 and 37: 22 CHAPTER 4. INSTRUMENTATIONrespec
- Page 38 and 39: 24 CHAPTER 4. INSTRUMENTATIONangle
- Page 40 and 41: 26 CHAPTER 4. INSTRUMENTATIONThe AC
- Page 42 and 43: ¨28 CHAPTER 4. INSTRUMENTATIONspli
- Page 44 and 45: 30 CHAPTER 4. INSTRUMENTATIONTable
- Page 46 and 47: 32 CHAPTER 5. CHANDRA OBSERVATIONS
- Page 48 and 49: 34 CHAPTER 5. CHANDRA OBSERVATIONS
- Page 50 and 51: 36 CHAPTER 5. CHANDRA OBSERVATIONS
- Page 52 and 53: 38 CHAPTER 5. CHANDRA OBSERVATIONS
- Page 54 and 55: 40 CHAPTER 5. CHANDRA OBSERVATIONS
- Page 56 and 57: 42 CHAPTER 5. CHANDRA OBSERVATIONS
- Page 58 and 59: 44 CHAPTER 5. CHANDRA OBSERVATIONS
- Page 60 and 61: 46 CHAPTER 5. CHANDRA OBSERVATIONS
- Page 62 and 63: 48 CHAPTER 5. CHANDRA OBSERVATIONS
- Page 64 and 65: 50 CHAPTER 5. CHANDRA OBSERVATIONS
- Page 66 and 67: 52 CHAPTER 5. CHANDRA OBSERVATIONS
- Page 68 and 69: 54 CHAPTER 5. CHANDRA OBSERVATIONS
- Page 70 and 71: 56 CHAPTER 5. CHANDRA OBSERVATIONS
- Page 72 and 73: 58 CHAPTER 6. INDIVIDUAL SOURCEShig
- Page 74 and 75: 60 CHAPTER 6. INDIVIDUAL SOURCESres
- Page 78 and 79: 64 CHAPTER 6. INDIVIDUAL SOURCESfla
- Page 80 and 81: 66 CHAPTER 6. INDIVIDUAL SOURCESTab
- Page 82 and 83: 68 CHAPTER 6. INDIVIDUAL SOURCESUsi
- Page 84 and 85: 70 CHAPTER 6. INDIVIDUAL SOURCESlos
- Page 86 and 87: 72 CHAPTER 6. INDIVIDUAL SOURCES6.3
- Page 88 and 89: 74 CHAPTER 6. INDIVIDUAL SOURCESdes
- Page 90 and 91: 76 CHAPTER 6. INDIVIDUAL SOURCESocc
- Page 92 and 93: 78 CHAPTER 6. INDIVIDUAL SOURCES6.4
- Page 94 and 95: 80 CHAPTER 6. INDIVIDUAL SOURCES6.4
- Page 96 and 97: 82 CHAPTER 6. INDIVIDUAL SOURCES6.5
- Page 98 and 99: 84 CHAPTER 6. INDIVIDUAL SOURCES6.5
- Page 100 and 101: 86 CHAPTER 6. INDIVIDUAL SOURCEStha
- Page 102 and 103: 88 CHAPTER 6. INDIVIDUAL SOURCES1ke
- Page 104 and 105: 90 CHAPTER 6. INDIVIDUAL SOURCESThe
- Page 106 and 107: 92 CHAPTER 6. INDIVIDUAL SOURCESFig
- Page 108 and 109: 94 CHAPTER 6. INDIVIDUAL SOURCESPra
- Page 110 and 111: 96 CHAPTER 7. OVERALL FEATURE OF X-
- Page 112 and 113: 98 CHAPTER 7. OVERALL FEATURE OF X-
- Page 114 and 115: 100 CHAPTER 7. OVERALL FEATURE OF X
- Page 116 and 117: 102 CHAPTER 7. OVERALL FEATURE OF X
- Page 118 and 119: 104 CHAPTER 7. OVERALL FEATURE OF X
- Page 121 and 122: Chapter 8Systematic Study of YSO Fl
- Page 123 and 124: 8.2. CORRELATION BETWEEN THE FLARE
- Page 125 and 126: 8.3. MAGNETIC RECONNECTION MODEL 11
- Page 127 and 128:
8.5. EFFECT OF THE QUIESCENT X-RAYS
- Page 129 and 130:
8.6. EVOLUTION OF YSOS AND THEIR FL
- Page 131 and 132:
Chapter 9ConclusionWe summarize the
- Page 133 and 134:
Appendix AFlare Light CurvesFig. A.
- Page 135 and 136:
Fig.A.2 (Continued)121
- Page 137:
Fig. A.4.— Same as Figure A.1, bu
- Page 140 and 141:
126 APPENDIX B. PHYSICAL PARAMETERS
- Page 142 and 143:
128 APPENDIX B. PHYSICAL PARAMETERS
- Page 145 and 146:
Appendix CModeling of the FlareIn t
- Page 147 and 148:
C.2. PREDICTED CORRELATIONS BETWEEN
- Page 149 and 150:
BibliographyAgeorges, N., Eckart, A
- Page 151 and 152:
BIBLIOGRAPHY 137Feigelson, E. D., &
- Page 153 and 154:
BIBLIOGRAPHY 139Johnstone, D., Wils
- Page 155 and 156:
BIBLIOGRAPHY 141Rutledge, R. E., Ba
- Page 157:
BIBLIOGRAPHY 143Yokoyama, T. & Shib