

X-ray Study of Low-mass Young Stellar Objects in the ρ Ophiuchi ...
X-ray Study of Low-mass Young Stellar Objects in the ρ Ophiuchi ...
X-ray Study of Low-mass Young Stellar Objects in the ρ Ophiuchi ...

You also want an ePaper? Increase the reach of your titles
YUMPU automatically turns print PDFs into web optimized ePapers that Google loves.
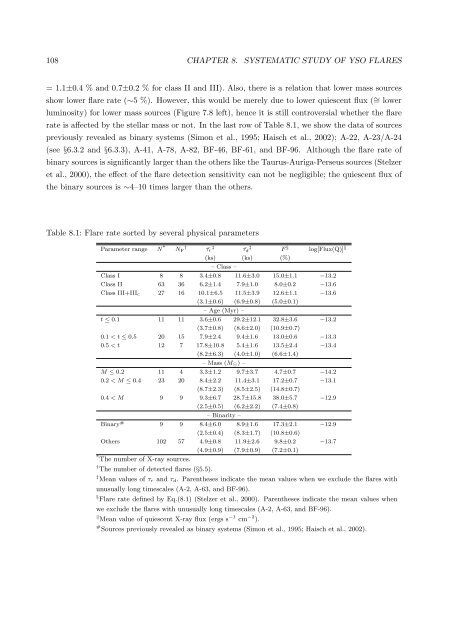
108 CHAPTER 8. SYSTEMATIC STUDY OF YSO FLARES= 1.1±0.4 % and 0.7±0.2 % for class II and III). Also, <strong>the</strong>re is a relation that lower <strong>mass</strong> sourcesshow lower flare rate (∼5 %). However, this would be merely due to lower quiescent flux ( ∼ = lowerlum<strong>in</strong>osity) for lower <strong>mass</strong> sources (Figure 7.8 left), hence it is still controversial whe<strong>the</strong>r <strong>the</strong> flarerate is affected by <strong>the</strong> stellar <strong>mass</strong> or not. In <strong>the</strong> last row <strong>of</strong> Table 8.1, we show <strong>the</strong> data <strong>of</strong> sourcespreviously revealed as b<strong>in</strong>ary systems (Simon et al., 1995; Haisch et al., 2002); A-22, A-23/A-24(see §6.3.2 and §6.3.3), A-41, A-78, A-82, BF-46, BF-61, and BF-96. Although <strong>the</strong> flare rate <strong>of</strong>b<strong>in</strong>ary sources is significantly larger than <strong>the</strong> o<strong>the</strong>rs like <strong>the</strong> Taurus-Auriga-Perseus sources (Stelzeret al., 2000), <strong>the</strong> effect <strong>of</strong> <strong>the</strong> flare detection sensitivity can not be negligible; <strong>the</strong> quiescent flux <strong>of</strong><strong>the</strong> b<strong>in</strong>ary sources is ∼4–10 times larger than <strong>the</strong> o<strong>the</strong>rs.Table 8.1: Flare rate sorted by several physical parametersParameter range N * N † F ¯τ ‡ r τ¯‡ d F § log[Flux(Q)] ‖(ks) (ks) (%)– Class –Class I 8 8 3.4±0.8 11.6±3.0 15.0±1.1 −13.2Class II 63 36 6.2±1.4 7.9±1.0 8.0±0.2 −13.6Class III+III c 27 16 10.1±6.5 11.5±3.9 12.6±1.1 −13.6(3.1±0.6) (6.9±0.8) (5.0±0.1)– Age (Myr) –t ≤ 0.1 11 11 3.6±0.6 29.2±12.1 32.8±3.6 −13.2(3.7±0.8) (8.6±2.0) (10.9±0.7)0.1 < t ≤ 0.5 20 15 7.9±2.4 9.4±1.6 13.0±0.6 −13.30.5 < t 12 7 17.8±10.8 5.4±1.6 13.5±2.4 −13.4(8.2±6.3) (4.0±1.0) (6.6±1.4)– Mass (M ⊙ ) –M ≤ 0.2 11 4 3.3±1.2 9.7±3.7 4.7±0.7 −14.20.2 < M ≤ 0.4 23 20 8.4±2.2 11.4±3.1 17.2±0.7 −13.1(8.7±2.3) (8.5±2.5) (14.8±0.7)0.4 < M 9 9 9.3±6.7 28.7±15.8 38.0±5.7 −12.9(2.5±0.5) (6.2±2.2) (7.4±0.8)– B<strong>in</strong>arity –B<strong>in</strong>ary # 9 9 8.4±6.0 8.9±1.6 17.3±2.1 −12.9(2.5±0.4) (8.3±1.7) (10.8±0.6)O<strong>the</strong>rs 102 57 4.9±0.8 11.9±2.6 9.8±0.2 −13.7(4.9±0.9) (7.9±0.9) (7.2±0.1)* The number <strong>of</strong> X-<strong>ray</strong> sources.† The number <strong>of</strong> detected flares (§5.5).‡ Mean values <strong>of</strong> τ r and τ d . Paren<strong>the</strong>ses <strong>in</strong>dicate <strong>the</strong> mean values when we exclude <strong>the</strong> flares withunusually long timescales (A-2, A-63, and BF-96).§ Flare rate def<strong>in</strong>ed by Eq.(8.1) (Stelzer et al., 2000). Paren<strong>the</strong>ses <strong>in</strong>dicate <strong>the</strong> mean values whenwe exclude <strong>the</strong> flares with unusually long timescales (A-2, A-63, and BF-96).‖ Mean value <strong>of</strong> quiescent X-<strong>ray</strong> flux (ergs s −1 cm −2 ).# Sources previously revealed as b<strong>in</strong>ary systems (Simon et al., 1995; Haisch et al., 2002).


