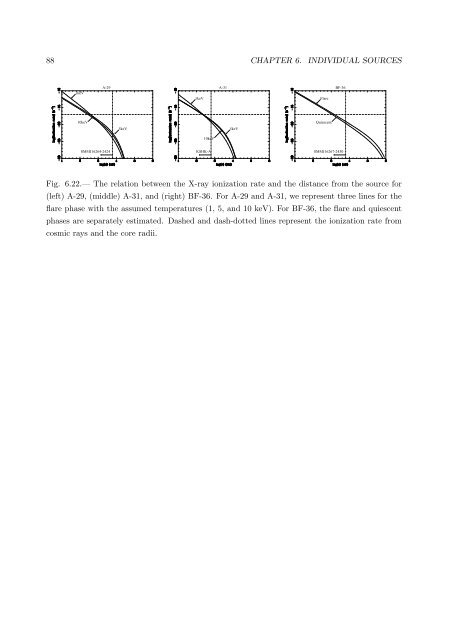
88 CHAPTER 6. INDIVIDUAL SOURCES1keVA-291keVA-31FlareBF-3610keV5keV5keVQuiescent10keVSMMJ16264-2424KSHK-ASMMJ16267-2430Fig. 6.22.— The relation between <strong>the</strong> X-<strong>ray</strong> ionization rate and <strong>the</strong> distance from <strong>the</strong> source for(left) A-29, (middle) A-31, and (right) BF-36. For A-29 and A-31, we represent three l<strong>in</strong>es for <strong>the</strong>flare phase with <strong>the</strong> assumed temperatures (1, 5, and 10 keV). For BF-36, <strong>the</strong> flare and quiescentphases are separately estimated. Dashed and dash-dotted l<strong>in</strong>es represent <strong>the</strong> ionization rate fromcosmic <strong>ray</strong>s and <strong>the</strong> core radii.
6.6. UNIDENTIFIED SOURCES 896.6 Unidentified Sources6.6.1 Overall featureIn order to exam<strong>in</strong>e <strong>the</strong> average feature <strong>of</strong> unidentified sources, we co-add and make compositespectra, separately for total-band, s<strong>of</strong>t-band, and hard-band sources (hereafter, we call <strong>the</strong>m “totalbandunidentified sources” and so on). We do not <strong>in</strong>clude A-29, A-31, BF-36, A-75 = BF-11, BF-92,BF-S7, and BF-H3 because <strong>the</strong>y have different nature from <strong>the</strong> o<strong>the</strong>r unidentified sources. A-H2 isalso excluded because <strong>of</strong> severe contam<strong>in</strong>ation from A-2 (DoAr21). Figure 6.23 shows <strong>the</strong> compositespectra. First we fit <strong>the</strong>m by <strong>the</strong> MEKAL model. However, uncomfortably high temperature (>20 keV) is obta<strong>in</strong>ed for <strong>the</strong> total- and hard-band unidentified sources. We hence re-fit <strong>the</strong>m by apower-law model and f<strong>in</strong>d acceptable fits. Figure 6.23 (solid l<strong>in</strong>es) and Table 6.7 show <strong>the</strong> best-fitmodels and parameters, respectively.Fig. 6.23.— Composite spectra <strong>of</strong> (a) total-band, (b) s<strong>of</strong>t-band, and (c) hard-band unidentifiedsources. The upper panels show data po<strong>in</strong>ts (crosses) and <strong>the</strong> best-fit non-<strong>the</strong>rmal (a and c) and<strong>the</strong>rmal (b) model (solid l<strong>in</strong>e), while <strong>the</strong> lower panels are <strong>the</strong> data residuals from <strong>the</strong> best-fit model.Circles and triangles represent <strong>the</strong> data for obs-A and obs-BF, respectively.The best-fit photon <strong>in</strong>dex (∼1.5) <strong>of</strong> <strong>the</strong> total-band unidentified sources is similar to that <strong>of</strong><strong>the</strong> canonical value <strong>of</strong> active galactic nuclei (AGNs: ∼1.7), while <strong>the</strong> best-fit N H <strong>of</strong> 5.3×10 22 cm −2is nearly equal to <strong>the</strong> average value through this cloud (Tachihara et al., 2000). Inversely, if <strong>the</strong>background sources have a mean photon <strong>in</strong>dex <strong>of</strong> 1.5 and are absorbed by <strong>the</strong> cloud gas <strong>of</strong> N H =5.3×10 22 cm −2 , <strong>the</strong> log N – log S relation by Mushotzky et al. (2000) predicts <strong>the</strong> detectable sourcenumbers to be several tens, which is consistent with <strong>the</strong> total number <strong>of</strong> unidentified sources (∼80).Also, <strong>the</strong> spatial distribution <strong>of</strong> <strong>the</strong> total-band unidentified sources seems to be anti-correlated with<strong>the</strong> molecular cloud (Figure 6.24). Most <strong>of</strong> <strong>the</strong> total-band unidentified sources <strong>the</strong>refore are likelyto be background AGNs, as well as <strong>the</strong> radio bright unidentified source A-75/BF-11 = LFAM21(§6.6.3).
- Page 3:
Contents1 Introduction 12 Review of
- Page 9 and 10:
List of Figures2.1 The H-R diagram
- Page 11 and 12:
LIST OF FIGURESix6.17 Light curves
- Page 13 and 14:
List of Tables3.1 Multiwavelength s
- Page 15 and 16:
Chapter 1IntroductionStar formation
- Page 17 and 18:
Chapter 2Review of Low-mass Young S
- Page 19 and 20:
2.1. EVOLUTION OF LOW-MASS STARS 5w
- Page 21 and 22:
2.2. MOLECULAR CLOUDS 72.2 Molecula
- Page 23 and 24:
2.3. X-RAY OBSERVATIONS OF LOW-MASS
- Page 25 and 26:
2.3. X-RAY OBSERVATIONS OF LOW-MASS
- Page 27:
2.3. X-RAY OBSERVATIONS OF LOW-MASS
- Page 30 and 31:
16 CHAPTER 3. REVIEW OF THE ρ OPHI
- Page 32 and 33:
18 CHAPTER 3. REVIEW OF THE ρ OPHI
- Page 34 and 35:
20 CHAPTER 3. REVIEW OF THE ρ OPHI
- Page 36 and 37:
22 CHAPTER 4. INSTRUMENTATIONrespec
- Page 38 and 39:
24 CHAPTER 4. INSTRUMENTATIONangle
- Page 40 and 41:
26 CHAPTER 4. INSTRUMENTATIONThe AC
- Page 42 and 43:
¨28 CHAPTER 4. INSTRUMENTATIONspli
- Page 44 and 45:
30 CHAPTER 4. INSTRUMENTATIONTable
- Page 46 and 47:
32 CHAPTER 5. CHANDRA OBSERVATIONS
- Page 48 and 49:
34 CHAPTER 5. CHANDRA OBSERVATIONS
- Page 50 and 51:
36 CHAPTER 5. CHANDRA OBSERVATIONS
- Page 52 and 53: 38 CHAPTER 5. CHANDRA OBSERVATIONS
- Page 54 and 55: 40 CHAPTER 5. CHANDRA OBSERVATIONS
- Page 56 and 57: 42 CHAPTER 5. CHANDRA OBSERVATIONS
- Page 58 and 59: 44 CHAPTER 5. CHANDRA OBSERVATIONS
- Page 60 and 61: 46 CHAPTER 5. CHANDRA OBSERVATIONS
- Page 62 and 63: 48 CHAPTER 5. CHANDRA OBSERVATIONS
- Page 64 and 65: 50 CHAPTER 5. CHANDRA OBSERVATIONS
- Page 66 and 67: 52 CHAPTER 5. CHANDRA OBSERVATIONS
- Page 68 and 69: 54 CHAPTER 5. CHANDRA OBSERVATIONS
- Page 70 and 71: 56 CHAPTER 5. CHANDRA OBSERVATIONS
- Page 72 and 73: 58 CHAPTER 6. INDIVIDUAL SOURCEShig
- Page 74 and 75: 60 CHAPTER 6. INDIVIDUAL SOURCESres
- Page 76 and 77: 62 CHAPTER 6. INDIVIDUAL SOURCES6.2
- Page 78 and 79: 64 CHAPTER 6. INDIVIDUAL SOURCESfla
- Page 80 and 81: 66 CHAPTER 6. INDIVIDUAL SOURCESTab
- Page 82 and 83: 68 CHAPTER 6. INDIVIDUAL SOURCESUsi
- Page 84 and 85: 70 CHAPTER 6. INDIVIDUAL SOURCESlos
- Page 86 and 87: 72 CHAPTER 6. INDIVIDUAL SOURCES6.3
- Page 88 and 89: 74 CHAPTER 6. INDIVIDUAL SOURCESdes
- Page 90 and 91: 76 CHAPTER 6. INDIVIDUAL SOURCESocc
- Page 92 and 93: 78 CHAPTER 6. INDIVIDUAL SOURCES6.4
- Page 94 and 95: 80 CHAPTER 6. INDIVIDUAL SOURCES6.4
- Page 96 and 97: 82 CHAPTER 6. INDIVIDUAL SOURCES6.5
- Page 98 and 99: 84 CHAPTER 6. INDIVIDUAL SOURCES6.5
- Page 100 and 101: 86 CHAPTER 6. INDIVIDUAL SOURCEStha
- Page 104 and 105: 90 CHAPTER 6. INDIVIDUAL SOURCESThe
- Page 106 and 107: 92 CHAPTER 6. INDIVIDUAL SOURCESFig
- Page 108 and 109: 94 CHAPTER 6. INDIVIDUAL SOURCESPra
- Page 110 and 111: 96 CHAPTER 7. OVERALL FEATURE OF X-
- Page 112 and 113: 98 CHAPTER 7. OVERALL FEATURE OF X-
- Page 114 and 115: 100 CHAPTER 7. OVERALL FEATURE OF X
- Page 116 and 117: 102 CHAPTER 7. OVERALL FEATURE OF X
- Page 118 and 119: 104 CHAPTER 7. OVERALL FEATURE OF X
- Page 121 and 122: Chapter 8Systematic Study of YSO Fl
- Page 123 and 124: 8.2. CORRELATION BETWEEN THE FLARE
- Page 125 and 126: 8.3. MAGNETIC RECONNECTION MODEL 11
- Page 127 and 128: 8.5. EFFECT OF THE QUIESCENT X-RAYS
- Page 129 and 130: 8.6. EVOLUTION OF YSOS AND THEIR FL
- Page 131 and 132: Chapter 9ConclusionWe summarize the
- Page 133 and 134: Appendix AFlare Light CurvesFig. A.
- Page 135 and 136: Fig.A.2 (Continued)121
- Page 137: Fig. A.4.— Same as Figure A.1, bu
- Page 140 and 141: 126 APPENDIX B. PHYSICAL PARAMETERS
- Page 142 and 143: 128 APPENDIX B. PHYSICAL PARAMETERS
- Page 145 and 146: Appendix CModeling of the FlareIn t
- Page 147 and 148: C.2. PREDICTED CORRELATIONS BETWEEN
- Page 149 and 150: BibliographyAgeorges, N., Eckart, A
- Page 151 and 152: BIBLIOGRAPHY 137Feigelson, E. D., &
- Page 153 and 154:
BIBLIOGRAPHY 139Johnstone, D., Wils
- Page 155 and 156:
BIBLIOGRAPHY 141Rutledge, R. E., Ba
- Page 157:
BIBLIOGRAPHY 143Yokoyama, T. & Shib