

X-ray Study of Low-mass Young Stellar Objects in the ρ Ophiuchi ...
X-ray Study of Low-mass Young Stellar Objects in the ρ Ophiuchi ...
X-ray Study of Low-mass Young Stellar Objects in the ρ Ophiuchi ...

Create successful ePaper yourself
Turn your PDF publications into a flip-book with our unique Google optimized e-Paper software.
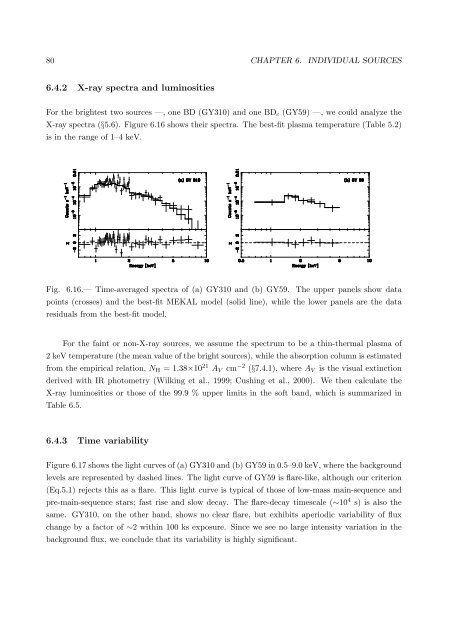
80 CHAPTER 6. INDIVIDUAL SOURCES6.4.2 X-<strong>ray</strong> spectra and lum<strong>in</strong>ositiesFor <strong>the</strong> brightest two sources —, one BD (GY310) and one BD c (GY59) —, we could analyze <strong>the</strong>X-<strong>ray</strong> spectra (§5.6). Figure 6.16 shows <strong>the</strong>ir spectra. The best-fit plasma temperature (Table 5.2)is <strong>in</strong> <strong>the</strong> range <strong>of</strong> 1–4 keV.Fig. 6.16.— Time-averaged spectra <strong>of</strong> (a) GY310 and (b) GY59. The upper panels show datapo<strong>in</strong>ts (crosses) and <strong>the</strong> best-fit MEKAL model (solid l<strong>in</strong>e), while <strong>the</strong> lower panels are <strong>the</strong> dataresiduals from <strong>the</strong> best-fit model.For <strong>the</strong> fa<strong>in</strong>t or non-X-<strong>ray</strong> sources, we assume <strong>the</strong> spectrum to be a th<strong>in</strong>-<strong>the</strong>rmal plasma <strong>of</strong>2 keV temperature (<strong>the</strong> mean value <strong>of</strong> <strong>the</strong> bright sources), while <strong>the</strong> absorption column is estimatedfrom <strong>the</strong> empirical relation, N H = 1.38×10 21 A V cm −2 (§7.4.1), where A V is <strong>the</strong> visual ext<strong>in</strong>ctionderived with IR photometry (Wilk<strong>in</strong>g et al., 1999; Cush<strong>in</strong>g et al., 2000). We <strong>the</strong>n calculate <strong>the</strong>X-<strong>ray</strong> lum<strong>in</strong>osities or those <strong>of</strong> <strong>the</strong> 99.9 % upper limits <strong>in</strong> <strong>the</strong> s<strong>of</strong>t band, which is summarized <strong>in</strong>Table 6.5.6.4.3 Time variabilityFigure 6.17 shows <strong>the</strong> light curves <strong>of</strong> (a) GY310 and (b) GY59 <strong>in</strong> 0.5–9.0 keV, where <strong>the</strong> backgroundlevels are represented by dashed l<strong>in</strong>es. The light curve <strong>of</strong> GY59 is flare-like, although our criterion(Eq.5.1) rejects this as a flare. This light curve is typical <strong>of</strong> those <strong>of</strong> low-<strong>mass</strong> ma<strong>in</strong>-sequence andpre-ma<strong>in</strong>-sequence stars; fast rise and slow decay. The flare-decay timescale (∼10 4 s) is also <strong>the</strong>same. GY310, on <strong>the</strong> o<strong>the</strong>r hand, shows no clear flare, but exhibits aperiodic variability <strong>of</strong> fluxchange by a factor <strong>of</strong> ∼2 with<strong>in</strong> 100 ks exposure. S<strong>in</strong>ce we see no large <strong>in</strong>tensity variation <strong>in</strong> <strong>the</strong>background flux, we conclude that its variability is highly significant.


