- Page 1 and 2:
Biopac Student Lab PRO ManualProfes
- Page 3 and 4:
Selecting an area..................
- Page 5 and 6:
Autoplotting and Scrolling ........
- Page 7 and 8:
Show modified input................
- Page 9 and 10:
Visit the BIOPAC website for more i
- Page 11 and 12:
Welcome 11Using this ManualThe Biop
- Page 13 and 14:
Welcome 13Biopac Student Lab PRO Fe
- Page 15 and 16:
Welcome 15PC 3.7.7 FeatureDescripti
- Page 17 and 18:
Welcome 17PC 3.7.7 FeatureDescripti
- Page 19 and 20:
Welcome 19Biopac Student Lab PRO Be
- Page 21 and 22:
Welcome 21PRO LessonsPRO Lessons il
- Page 23 and 24:
23Part A — IntroductionPart A - I
- Page 25 and 26:
Introduction 25b) You may have a de
- Page 27 and 28:
Introduction 27Launch errorsBSL PRO
- Page 29 and 30:
Introduction 29The Data Viewing Scr
- Page 31 and 32:
Introduction 31IconFunctionShow/Hid
- Page 33 and 34:
Introduction 33Right-click Shortcut
- Page 35 and 36:
Introduction 35ScaleAny changes you
- Page 37 and 38:
Introduction 37Vertical scaleClick
- Page 39 and 40:
Introduction 39When Optimize Range
- Page 41 and 42:
Introduction 41Overlap Segments may
- Page 43 and 44:
43Part B — Recording DataPart B -
- Page 45 and 46:
Recording Data 45Set up channelsSel
- Page 47 and 48:
Recording Data 47Setup Acquisitions
- Page 49 and 50:
Recording Data 49Chapter 3Selecting
- Page 51 and 52:
Recording Data 51GridsYou can apply
- Page 53 and 54:
Recording Data 53Transforming dataT
- Page 55 and 56:
Recording Data 55Journal File Funct
- Page 57 and 58:
Recording Data 57NOTE: You may also
- Page 59 and 60:
Recording Data 59Customizing Menu F
- Page 61 and 62:
Recording Data 61The Startup script
- Page 63 and 64:
Recording Data 63Adding BSL PRO Ana
- Page 65 and 66:
Recording Data 655. Set Q = 0 to en
- Page 67 and 68:
Acquisition Functions 67Chapter 5Re
- Page 69 and 70:
Acquisition Functions 69Advanced Ch
- Page 71 and 72:
Acquisition Functions 71Acquire Dat
- Page 73 and 74:
Acquisition Functions 73View/Change
- Page 75 and 76:
Acquisition Functions 75Analog scal
- Page 77 and 78:
Acquisition Functions 77Plot Standa
- Page 79 and 80:
Acquisition Functions 79Chapter 6Se
- Page 81 and 82:
Acquisition Functions 81Sample Rate
- Page 83 and 84:
Acquisition Functions 83EXAMPLES OF
- Page 85 and 86:
Acquisition Functions 85Acquisition
- Page 87 and 88:
Acquisition Functions 87Chapter 7Ch
- Page 89 and 90:
Acquisition Functions 89Input Chann
- Page 91 and 92:
Acquisition Functions 91Digital Fil
- Page 93 and 94:
93 Acquisition FunctionsCalculation
- Page 95 and 96:
Acquisition Functions 95Average ove
- Page 97 and 98:
Acquisition Functions 97Integrate
- Page 99 and 100:
Acquisition Functions 99INTEGRATE
- Page 101 and 102:
Acquisition Functions 101Calculatio
- Page 103 and 104:
Acquisition Functions 103Rate Usage
- Page 105 and 106:
Acquisition Functions 105Calculatio
- Page 107 and 108:
Acquisition Functions 107Calculatio
- Page 109 and 110:
Acquisition Functions 109Calculatio
- Page 111 and 112:
Acquisition Functions 111Calculatio
- Page 113 and 114:
Acquisition Functions 113Digital ch
- Page 115 and 116:
Acquisition Functions 115Control di
- Page 117 and 118: Acquisition Functions 117Chapter 8O
- Page 119 and 120: Acquisition Functions 119CH# to Out
- Page 121 and 122: Acquisition Functions 121Voltage Ou
- Page 123 and 124: Acquisition Functions 123To use one
- Page 125 and 126: Acquisition Functions 125Preference
- Page 127 and 128: Acquisition Functions 127The option
- Page 129 and 130: Acquisition Functions 129Output Con
- Page 131 and 132: Acquisition Functions 131GENERAL TA
- Page 133 and 134: Acquisition Functions 133GENERAL TA
- Page 135 and 136: Acquisition Functions 135ADVANCED T
- Page 137 and 138: Acquisition Functions 137Output Pre
- Page 139 and 140: Acquisition Functions 139REFERENCES
- Page 141 and 142: Acquisition Functions 141Usage Guid
- Page 143 and 144: Acquisition Functions 143Chapter 9G
- Page 145 and 146: Acquisition Functions 145IndicatorO
- Page 147 and 148: Acquisition Functions 147Setting up
- Page 149 and 150: Acquisition Functions 149Chapter 10
- Page 151 and 152: Acquisition Functions 151Show Input
- Page 153 and 154: Acquisition Functions 153Autoplotti
- Page 155 and 156: Acquisition Functions 155Rename a P
- Page 157 and 158: Analysis Functions 157Chapter 11 Me
- Page 159 and 160: Analysis Functions 159IMPORTANT! Th
- Page 161 and 162: Analysis Functions 161The table bel
- Page 163 and 164: Analysis Functions 163MEASUREMENT A
- Page 165 and 166: Analysis Functions 165MEASUREMENT A
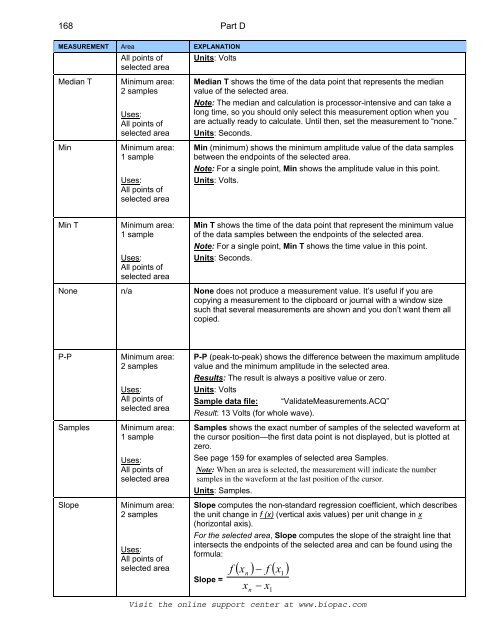
- Page 167: Analysis Functions 167MEASUREMENT A
- Page 171 and 172: Analysis Functions 171MEASUREMENT A
- Page 173 and 174: Analysis Functions 173EXAMPLE OF MA
- Page 175 and 176: Analysis Functions 175Unlocked Grid
- Page 177 and 178: Analysis Functions 177A few Grid Op
- Page 179 and 180: Analysis Functions 179Chapter 12 Fi
- Page 181 and 182: Analysis Functions 181Text files (*
- Page 183 and 184: Analysis Functions 183After OK is c
- Page 185 and 186: Analysis Functions 185Save Options
- Page 187 and 188: Analysis Functions 187PrintThe Prin
- Page 189 and 190: Analysis Functions 189Preferences..
- Page 191 and 192: Analysis Functions 191Journal Prefe
- Page 193 and 194: Analysis Functions 193Chapter 13 Ed
- Page 195 and 196: Analysis Functions 195ClearThe Clea
- Page 197 and 198: Analysis Functions 197Copy GraphCop
- Page 199 and 200: 199Chapter 14 Transform menu comman
- Page 201 and 202: 201Digital FiltersThere is a fair a
- Page 203 and 204: 203FIR Filter exampleComparison of
- Page 205 and 206: 205The following table describes th
- Page 207 and 208: 207Math FunctionTransformation Resu
- Page 209 and 210: 209A drifting baseline can be a pro
- Page 211 and 212: 211IntegralThe integral function is
- Page 213 and 214: 213SmoothingSmoothing computes the
- Page 215 and 216: 215DifferenceThe Difference functio
- Page 217 and 218: 217ResampleThis function resamples
- Page 219 and 220:
219SourceFunctionOperatorDestinatio
- Page 221 and 222:
221WAVEFORM MATH EXAMPLEWaveform Ma
- Page 223 and 224:
223Fast Fourier Transformation cont
- Page 225 and 226:
225The raw data, prior to FFT:This
- Page 227 and 228:
227Don’t Find — Allows you to r
- Page 229 and 230:
Find Next Peak229If you select Find
- Page 231 and 232:
231FIND PEAK -- DATA REDUCTION EXAM
- Page 233 and 234:
233FIND PEAK -- OFF-LINE AVERAGING
- Page 235 and 236:
235A time offset can be added to th
- Page 237 and 238:
237Find RateThe Find Rate function
- Page 239 and 240:
239Put Result inNew GraphFind Rate
- Page 241 and 242:
241Tile WaveformsChoosing Tile wave
- Page 243 and 244:
243Autoscale HorizontalThe Autoscal
- Page 245 and 246:
245Horizontal Axis...This option ge
- Page 247 and 248:
247Statistics...The Statistics comm
- Page 249 and 250:
249n the hardware portion of the di
- Page 251 and 252:
Appendices 251Media SetupVideo Capt
- Page 253 and 254:
Appendices 253Recording Media While
- Page 255 and 256:
Appendices 255The playback can be s
- Page 257 and 258:
Appendices 257Data file nameBPM Gau
- Page 259 and 260:
Appendices 259Data file nameEEG.acq
- Page 261 and 262:
Appendices 261Data file nameHeartTe
- Page 263 and 264:
Appendices 263Data file nameSS19L G
- Page 265 and 266:
Appendices 265Data file nameValidat
- Page 267 and 268:
Appendices 267Analog Preset NameCha
- Page 269 and 270:
Appendices 269Analog Preset NameCha
- Page 271 and 272:
Appendices 271Analog Preset NameCha
- Page 273 and 274:
Appendices 273Analog Preset NameCha
- Page 275 and 276:
Appendices 275Analog Preset NameCha
- Page 277 and 278:
Appendices 277Analog Preset NameCha
- Page 279 and 280:
Appendices 279Calculation PresetNam
- Page 281 and 282:
Appendices 281Calculation PresetNam
- Page 283 and 284:
Appendices 283Calculation PresetNam
- Page 285 and 286:
Appendices 285Electrodes are relati
- Page 287 and 288:
Appendices 287DC InputUse the DC In
- Page 289 and 290:
Appendices 289MP36/35 Input > Outpu
- Page 291 and 292:
Appendices 291Appendix E - Frequent
- Page 293 and 294:
Appendices 293Q: My MP UNIT seems t
- Page 295 and 296:
Appendices 295Appendix G — Filter
- Page 297 and 298:
Appendices 297The first graph shows
- Page 299 and 300:
Appendices 299Appendix H — About
- Page 301 and 302:
Appendices 301Appendix I — Accele
- Page 303 and 304:
Appendices 303Hot KeySeqAltkeysSeqG
- Page 305 and 306:
305IndexA/D boards (third party), 2
- Page 307 and 308:
Index Index 307IIR Filters, 201Inte
- Page 309 and 310:
Index Index 309PlotAutoPlotting opt
- Page 311:
Index Index 311Wave Color, 244Wavef