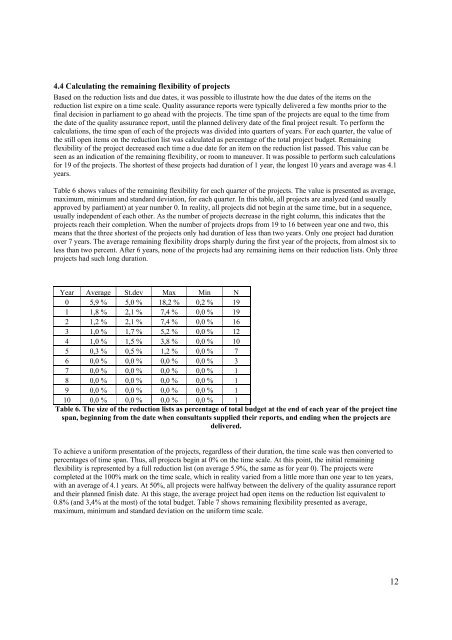
4.4 Calculating the remaining flexibility of projectsBased on the reduction lists and due dates, it was possible <strong>to</strong> illustrate how the due dates of the items on thereduction list expire on a time scale. Quality assurance reports were typically delivered a few months prior <strong>to</strong> thefinal decision in parliament <strong>to</strong> go ahead with the projects. The time span of the projects are equal <strong>to</strong> the time fromthe date of the quality assurance report, until the planned delivery date of the final project result. To perform thecalculations, the time span of each of the projects was divided in<strong>to</strong> quarters of years. For each quarter, the value ofthe still open items on the reduction list was calculated as percentage of the <strong>to</strong>tal project budget. Remainingflexibility of the project decreased each time a due date for an item on the reduction list passed. This value can beseen as an indication of the remaining flexibility, or room <strong>to</strong> maneuver. It was possible <strong>to</strong> perform such calculationsfor 19 of the projects. The shortest of these projects had duration of 1 year, the longest 10 years and average was 4.1years.Table 6 shows values of the remaining flexibility for each quarter of the projects. The value is presented as average,maximum, minimum and standard deviation, for each quarter. In this table, all projects are analyzed (and usuallyapproved by parliament) at year number 0. In reality, all projects did not begin at the same time, but in a sequence,usually independent of each other. As the number of projects decrease in the right column, this indicates that theprojects reach their completion. When the number of projects drops from 19 <strong>to</strong> 16 between year one and two, thismeans that the three shortest of the projects only had duration of less than two years. Only one project had durationover 7 years. The average remaining flexibility drops sharply during the first year of the projects, from almost six <strong>to</strong>less than two percent. After 6 years, none of the projects had any remaining items on their reduction lists. Only threeprojects had such long duration.Year Average St.dev Max Min N0 5,9 % 5,0 % 18,2 % 0,2 % 191 1,8 % 2,1 % 7,4 % 0,0 % 192 1,2 % 2,1 % 7,4 % 0,0 % 163 1,0 % 1,7 % 5,2 % 0,0 % 124 1,0 % 1,5 % 3,8 % 0,0 % 105 0,3 % 0,5 % 1,2 % 0,0 % 76 0,0 % 0,0 % 0,0 % 0,0 % 37 0,0 % 0,0 % 0,0 % 0,0 % 18 0,0 % 0,0 % 0,0 % 0,0 % 19 0,0 % 0,0 % 0,0 % 0,0 % 110 0,0 % 0,0 % 0,0 % 0,0 % 1Table 6. The size of the reduction lists as percentage of <strong>to</strong>tal budget at the end of each year of the project tinespan, beginning from the date when consultants supplied their reports, and ending when the projects aredelivered.To achieve a uniform presentation of the projects, regardless of their duration, the time scale was then converted <strong>to</strong>percentages of time span. Thus, all projects begin at 0% on the time scale. At this point, the initial remainingflexibility is represented by a full reduction list (on average 5.9%, the same as for year 0). The projects werecompleted at the 100% mark on the time scale, which in reality varied from a little more than one year <strong>to</strong> ten years,with an average of 4.1 years. At 50%, all projects were halfway between the delivery of the quality assurance reportand their planned finish date. At this stage, the average project had open items on the reduction list equivalent <strong>to</strong>0.8% (and 3,4% at the most) of the <strong>to</strong>tal budget. Table 7 shows remaining flexibility presented as average,maximum, minimum and standard deviation on the uniform time scale.12
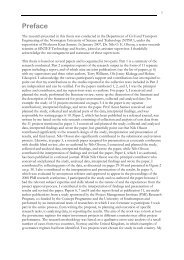
Percent ofproject onSize of remaining items on reduction liststime scale Average St.dev Max Min0 % 5,9 % 5,0 % 18,2 % 0,2 %10 % 5,2 % 4,9 % 18,2 % 0,0 %20 % 2,9 % 4,0 % 17,2 % 0,0 %30 % 1,7 % 1,8 % 5,7 % 0,0 %40 % 1,5 % 1,7 % 5,4 % 0,0 %50 % 0,8 % 1,2 % 3,4 % 0,0 %60 % 0,4 % 0,9 % 3,4 % 0,0 %70 % 0,3 % 0,8 % 3,4 % 0,0 %80 % 0,2 % 0,8 % 3,4 % 0,0 %90 % 0,1 % 0,3 % 1,2 % 0,0 %100 % 0,0 % 0,0 % 0,0 % 0,0 %Table 7. The size of the reduction lists as percentage of <strong>to</strong>tal budget at different phases of the projects,beginning from the date when consultants supplied their reports, and ending when the projects are delivered.N=194.5 ReservesIt is also a part of the consultants’ assignment <strong>to</strong> recommend a budget for the project. The projects are typicallyassigned a budget which consists of the expected cost including expected extras. In addition, reserves were allocated<strong>to</strong> the investments in order <strong>to</strong> avoid the need for additional funding. The intention with the allocated reserves was <strong>to</strong>mitigate project risks that could not be fully predictedCostSubjectiveprobabilityPercentage of <strong>to</strong>talallocated budgetP85P50ReductionlistsReservesExpectedadditionalcost100%92%(N=30)8%(N=45)94%(N=30)85%(N=20)BasicbudgetManagedby agencyManagedby PMFigure 2. Project budget and reserves13
- Page 1 and 2:
ISBN 82-471-8121-5 (printed ver.)IS
- Page 3:
Preface and AcknowledgementsThe wor
- Page 7 and 8:
Table of ContentsPreface and Acknow
- Page 9 and 10:
Paper OverviewThe following papers
- Page 11 and 12:
AbstractTraditionally, projects ten
- Page 13 and 14:
alternative use. There are indicati
- Page 15 and 16:
1. Introduction1. IntroductionThis
- Page 17 and 18:
1. IntroductionFlexible projects ar
- Page 19 and 20:
1. IntroductionA literature review
- Page 21 and 22:
2. Study design2. Study designThe r
- Page 23 and 24:
2. Study designInformation Content
- Page 25 and 26:
3. Flexibility in different project
- Page 27 and 28:
3. Flexibility in different project
- Page 29 and 30:
3. Flexibility in different project
- Page 31 and 32:
4. Project stakeholders4. Project s
- Page 33 and 34:
4. Project stakeholdersmandatory qu
- Page 35 and 36:
4. Project stakeholdersBased on res
- Page 37 and 38:
5. Effectiveness and efficiency5. E
- Page 39 and 40:
5. Effectiveness and efficiencyconf
- Page 41 and 42:
5. Effectiveness and efficiencyDegr
- Page 43 and 44:
6. Project flexibility categorisati
- Page 45 and 46:
6. Project flexibility categorisati
- Page 47 and 48:
6. Project flexibility categorisati
- Page 49 and 50: 7. Conclusions7. ConclusionsThis th
- Page 51 and 52: 7. ConclusionsProject phasesFlexibi
- Page 53 and 54: 7. ConclusionsEnablersThis thesis r
- Page 55 and 56: 7. Conclusions16, Figure 17, and Fi
- Page 57 and 58: 7. Conclusions4. AbsorptionAbsorpti
- Page 59 and 60: 7. ConclusionsThere appears to be a
- Page 61 and 62: ReferencesAbbot, A. & Banerji, K. 2
- Page 63 and 64: Gareis, R. 2004. Maturity of the Pr
- Page 65 and 66: Miller, R. & Lessard, D. 2000. The
- Page 67 and 68: Part 2.
- Page 69 and 70: Paper 1.Olsson, N.O.E. 2006. Manage
- Page 71 and 72: N.O.E. Olsson / International Journ
- Page 73 and 74: N.O.E. Olsson / International Journ
- Page 75 and 76: N.O.E. Olsson / International Journ
- Page 77 and 78: N.O.E. Olsson / International Journ
- Page 79 and 80: Paper 2.Magnussen, O.M. & Olsson, N
- Page 81 and 82: 282 O.M. Magnussen, N.O.E. Olsson /
- Page 83 and 84: 284 O.M. Magnussen, N.O.E. Olsson /
- Page 85 and 86: 286 O.M. Magnussen, N.O.E. Olsson /
- Page 87 and 88: 288 O.M. Magnussen, N.O.E. Olsson /
- Page 89 and 90: Projects trapped in their freedom:
- Page 91 and 92: 1. IntroductionThe purpose of this
- Page 93 and 94: project phases: preparation, freezi
- Page 95 and 96: establish realistic cost and time f
- Page 97 and 98: 4. ResultsIn the following, the emp
- Page 99: lowered the quality but the volume
- Page 103 and 104: flexibility is introduced by the us
- Page 105 and 106: 100 %First official estimateApprova
- Page 107 and 108: ReferencesAndersen, B., Fagerhaug,
- Page 109 and 110: Paper 4.Olsson, N.O.E. 2004. ‘Fle
- Page 111 and 112: The concept of project flexibilityF
- Page 113 and 114: 3. CONCLUSIONSWhat seems to be impl
- Page 115 and 116: Paper 5.Olsson, N.O.E. 2006. ‘Imp
- Page 117 and 118: 558 N. O. E. Olsson et al.ex-post s
- Page 119 and 120: 560 N. O. E. Olsson et al.Table 1.O
- Page 121 and 122: 562 N. O. E. Olsson et al.and actua
- Page 123 and 124: 564 N. O. E. Olsson et al.Table 3.
- Page 125 and 126: 566 N. O. E. Olsson et al.Table 7.S
- Page 127 and 128: 568 N. O. E. Olsson et al.with a wi
- Page 129 and 130: Paper 6.Henriksen, B., Olsson, N. &
- Page 131 and 132: In this paper we use the process an
- Page 133 and 134: PROCESS ANALYSIS IN THE PLANNING OF
- Page 135 and 136: final framework for expected patien
- Page 137 and 138: User involvement also generated exp
- Page 139: Paper 7.Olsson, N.O.E. & Samset, K.
- Page 155 and 156:
Project flexibility and front-end m
- Page 157 and 158:
uncertainty. External flexibility c
- Page 159 and 160:
5.2. Flexibility in decision proces
- Page 161 and 162:
Degree of redundancySlackPrecisionC