Link to thesis - Concept - NTNU
Link to thesis - Concept - NTNU
Link to thesis - Concept - NTNU
Create successful ePaper yourself
Turn your PDF publications into a flip-book with our unique Google optimized e-Paper software.
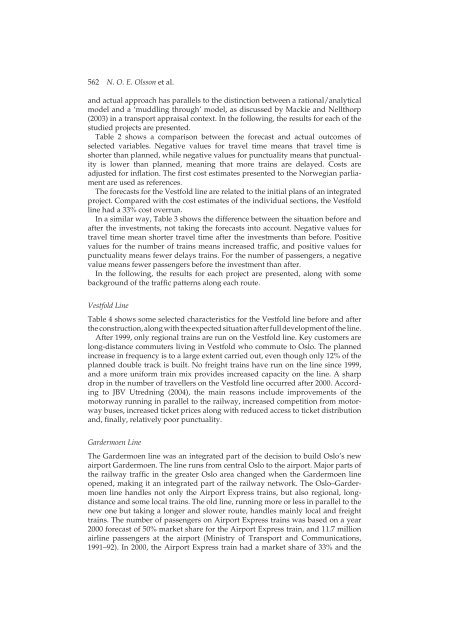
562 N. O. E. Olsson et al.and actual approach has parallels <strong>to</strong> the distinction between a rational/analyticalmodel and a ‘muddling through’ model, as discussed by Mackie and Nellthorp(2003) in a transport appraisal context. In the following, the results for each of thestudied projects are presented.Table 2 shows a comparison between the forecast and actual outcomes ofselected variables. Negative values for travel time means that travel time isshorter than planned, while negative values for punctuality means that punctualityis lower than planned, meaning that more trains are delayed. Costs areadjusted for inflation. The first cost estimates presented <strong>to</strong> the Norwegian parliamentare used as references.The forecasts for the Vestfold line are related <strong>to</strong> the initial plans of an integratedproject. Compared with the cost estimates of the individual sections, the Vestfoldline had a 33% cost overrun.In a similar way, Table 3 shows the difference between the situation before andafter the investments, not taking the forecasts in<strong>to</strong> account. Negative values fortravel time mean shorter travel time after the investments than before. Positivevalues for the number of trains means increased traffic, and positive values forpunctuality means fewer delays trains. For the number of passengers, a negativevalue means fewer passengers before the investment than after.In the following, the results for each project are presented, along with somebackground of the traffic patterns along each route.Vestfold LineTable 4 shows some selected characteristics for the Vestfold line before and afterthe construction, along with the expected situation after full development of the line.After 1999, only regional trains are run on the Vestfold line. Key cus<strong>to</strong>mers arelong-distance commuters living in Vestfold who commute <strong>to</strong> Oslo. The plannedincrease in frequency is <strong>to</strong> a large extent carried out, even though only 12% of theplanned double track is built. No freight trains have run on the line since 1999,and a more uniform train mix provides increased capacity on the line. A sharpdrop in the number of travellers on the Vestfold line occurred after 2000. According<strong>to</strong> JBV Utredning (2004), the main reasons include improvements of themo<strong>to</strong>rway running in parallel <strong>to</strong> the railway, increased competition from mo<strong>to</strong>rwaybuses, increased ticket prices along with reduced access <strong>to</strong> ticket distributionand, finally, relatively poor punctuality.Gardermoen LineThe Gardermoen line was an integrated part of the decision <strong>to</strong> build Oslo’s newairport Gardermoen. The line runs from central Oslo <strong>to</strong> the airport. Major parts ofthe railway traffic in the greater Oslo area changed when the Gardermoen lineopened, making it an integrated part of the railway network. The Oslo–Gardermoenline handles not only the Airport Express trains, but also regional, longdistanceand some local trains. The old line, running more or less in parallel <strong>to</strong> thenew one but taking a longer and slower route, handles mainly local and freighttrains. The number of passengers on Airport Express trains was based on a year2000 forecast of 50% market share for the Airport Express train, and 11.7 millionairline passengers at the airport (Ministry of Transport and Communications,1991–92). In 2000, the Airport Express train had a market share of 33% and the


