Link to thesis - Concept - NTNU
Link to thesis - Concept - NTNU
Link to thesis - Concept - NTNU

Create successful ePaper yourself
Turn your PDF publications into a flip-book with our unique Google optimized e-Paper software.
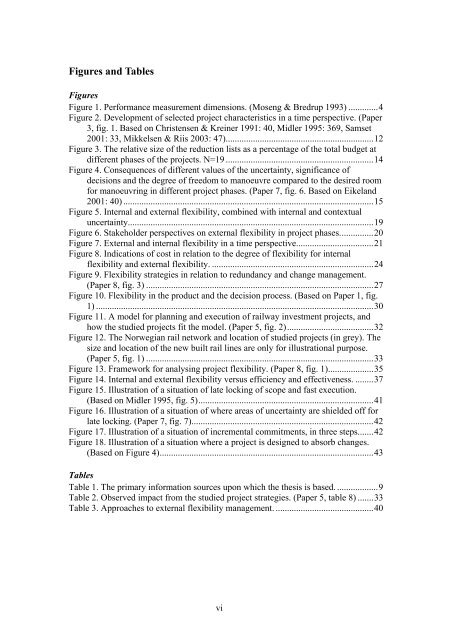
Figures and TablesFiguresFigure 1. Performance measurement dimensions. (Moseng & Bredrup 1993) .............4Figure 2. Development of selected project characteristics in a time perspective. (Paper3, fig. 1. Based on Christensen & Kreiner 1991: 40, Midler 1995: 369, Samset2001: 33, Mikkelsen & Riis 2003: 47).................................................................12Figure 3. The relative size of the reduction lists as a percentage of the <strong>to</strong>tal budget atdifferent phases of the projects. N=19 .................................................................14Figure 4. Consequences of different values of the uncertainty, significance ofdecisions and the degree of freedom <strong>to</strong> manoeuvre compared <strong>to</strong> the desired roomfor manoeuvring in different project phases. (Paper 7, fig. 6. Based on Eikeland2001: 40) ..............................................................................................................15Figure 5. Internal and external flexibility, combined with internal and contextualuncertainty............................................................................................................19Figure 6. Stakeholder perspectives on external flexibility in project phases...............20Figure 7. External and internal flexibility in a time perspective..................................21Figure 8. Indications of cost in relation <strong>to</strong> the degree of flexibility for internalflexibility and external flexibility. .......................................................................24Figure 9. Flexibility strategies in relation <strong>to</strong> redundancy and change management.(Paper 8, fig. 3) ....................................................................................................27Figure 10. Flexibility in the product and the decision process. (Based on Paper 1, fig.1) ..........................................................................................................................30Figure 11. A model for planning and execution of railway investment projects, andhow the studied projects fit the model. (Paper 5, fig. 2)......................................32Figure 12. The Norwegian rail network and location of studied projects (in grey). Thesize and location of the new built rail lines are only for illustrational purpose.(Paper 5, fig. 1) ....................................................................................................33Figure 13. Framework for analysing project flexibility. (Paper 8, fig. 1)....................35Figure 14. Internal and external flexibility versus efficiency and effectiveness. ........37Figure 15. Illustration of a situation of late locking of scope and fast execution.(Based on Midler 1995, fig. 5).............................................................................41Figure 16. Illustration of a situation of where areas of uncertainty are shielded off forlate locking. (Paper 7, fig. 7)................................................................................42Figure 17. Illustration of a situation of incremental commitments, in three steps.......42Figure 18. Illustration of a situation where a project is designed <strong>to</strong> absorb changes.(Based on Figure 4)..............................................................................................43TablesTable 1. The primary information sources upon which the <strong>thesis</strong> is based. ..................9Table 2. Observed impact from the studied project strategies. (Paper 5, table 8) .......33Table 3. Approaches <strong>to</strong> external flexibility management. ...........................................40vi