Link to thesis - Concept - NTNU
Link to thesis - Concept - NTNU
Link to thesis - Concept - NTNU

You also want an ePaper? Increase the reach of your titles
YUMPU automatically turns print PDFs into web optimized ePapers that Google loves.
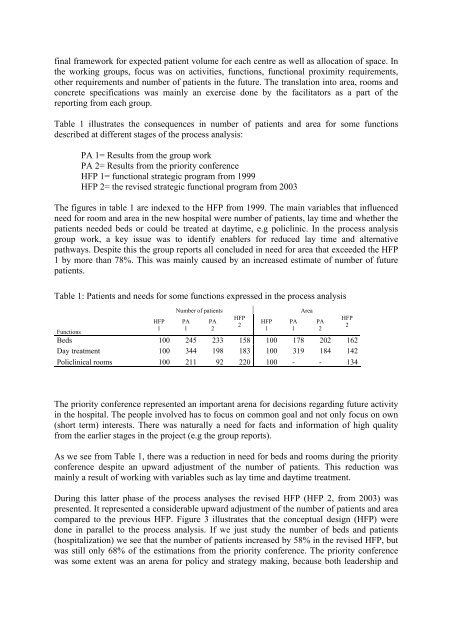
final framework for expected patient volume for each centre as well as allocation of space. Inthe working groups, focus was on activities, functions, functional proximity requirements,other requirements and number of patients in the future. The translation in<strong>to</strong> area, rooms andconcrete specifications was mainly an exercise done by the facilita<strong>to</strong>rs as a part of thereporting from each group.Table 1 illustrates the consequences in number of patients and area for some functionsdescribed at different stages of the process analysis:PA 1= Results from the group workPA 2= Results from the priority conferenceHFP 1= functional strategic program from 1999HFP 2= the revised strategic functional program from 2003The figures in table 1 are indexed <strong>to</strong> the HFP from 1999. The main variables that influencedneed for room and area in the new hospital were number of patients, lay time and whether thepatients needed beds or could be treated at daytime, e.g policlinic. In the process analysisgroup work, a key issue was <strong>to</strong> identify enablers for reduced lay time and alternativepathways. Despite this the group reports all concluded in need for area that exceeded the HFP1 by more than 78%. This was mainly caused by an increased estimate of number of futurepatients.Table 1: Patients and needs for some functions expressed in the process analysisFunctionsHFP1Number of patientsPA1Beds 100 245 233 158 100 178 202 162Day treatment 100 344 198 183 100 319 184 142Policlinical rooms 100 211 92 220 100 - - 134PA2HFP2HFP1PA1AreaPA2HFP2The priority conference represented an important arena for decisions regarding future activityin the hospital. The people involved has <strong>to</strong> focus on common goal and not only focus on own(short term) interests. There was naturally a need for facts and information of high qualityfrom the earlier stages in the project (e.g the group reports).As we see from Table 1, there was a reduction in need for beds and rooms during the priorityconference despite an upward adjustment of the number of patients. This reduction wasmainly a result of working with variables such as lay time and daytime treatment.During this latter phase of the process analyses the revised HFP (HFP 2, from 2003) waspresented. It represented a considerable upward adjustment of the number of patients and areacompared <strong>to</strong> the previous HFP. Figure 3 illustrates that the conceptual design (HFP) weredone in parallel <strong>to</strong> the process analysis. If we just study the number of beds and patients(hospitalization) we see that the number of patients increased by 58% in the revised HFP, butwas still only 68% of the estimations from the priority conference. The priority conferencewas some extent was an arena for policy and strategy making, because both leadership and