- Page 1 and 2:
CABARRUS COUNTYBOARD OF COMMISSIONE
- Page 3 and 4:
2. Library - Annual State Report3.
- Page 5 and 6:
October 3, 2011 (Work Session)PageT
- Page 7 and 8:
October 3, 2011 (Work Session)PageC
- Page 9 and 10:
October 3, 2011 (Work Session)PageK
- Page 11 and 12:
October 3, 2011 (Work Session)PageU
- Page 13 and 14:
October 17, 2011 (Regular Meeting)P
- Page 15 and 16:
October 17, 2011 (Regular Meeting)P
- Page 17 and 18:
October 17, 2011 (Regular Meeting)P
- Page 19 and 20:
October 17, 2011 (Regular Meeting)P
- Page 21 and 22:
October 17, 2011 (Regular Meeting)P
- Page 23 and 24:
October 17, 2011 (Regular Meeting)P
- Page 25 and 26:
October 17, 2011 (Regular Meeting)P
- Page 27 and 28:
October 17, 2011 (Regular Meeting)P
- Page 29 and 30:
October 17, 2011 (Regular Meeting)P
- Page 31 and 32:
October 17, 2011 (Regular Meeting)P
- Page 33 and 34:
October 17, 2011 (Regular Meeting)P
- Page 35 and 36:
October 17, 2011 (Regular Meeting)P
- Page 37 and 38:
October 17, 2011 (Regular Meeting)P
- Page 39 and 40:
October 17, 2011 (Regular Meeting)P
- Page 41 and 42:
October 17, 2011 (Regular Meeting)P
- Page 43 and 44:
October 17, 2011 (Regular Meeting)P
- Page 45 and 46:
October 17, 2011 (Regular Meeting)P
- Page 47 and 48:
October 17, 2011 (Regular Meeting)P
- Page 50 and 51:
October 17, 2011 (Regular Meeting)P
- Page 52 and 53:
October 17, 2011 (Regular Meeting)P
- Page 54 and 55:
October 17, 2011 (Regular Meeting)P
- Page 56 and 57:
October 17, 2011 (Regular Meeting)P
- Page 58 and 59:
October 17, 2011 (Regular Meeting)P
- Page 60 and 61:
October 17, 2011 (Regular Meeting)P
- Page 62 and 63:
October 17, 2011 (Regular Meeting)P
- Page 64 and 65:
October 17, 2011 (Regular Meeting)P
- Page 66 and 67:
October 17, 2011 (Regular Meeting)P
- Page 68 and 69:
October 17, 2011 (Regular Meeting)P
- Page 70 and 71:
October 17, 2011 (Regular Meeting)P
- Page 72 and 73:
October 17, 2011 (Regular Meeting)P
- Page 74 and 75:
October 17, 2011 (Regular Meeting)P
- Page 76 and 77:
October 17, 2011 (Regular Meeting)P
- Page 78 and 79:
October 17, 2011 (Regular Meeting)P
- Page 80 and 81:
October 17, 2011 (Regular Meeting)P
- Page 82 and 83:
October 17, 2011 (Regular Meeting)P
- Page 84 and 85:
October 17, 2011 (Regular Meeting)P
- Page 86 and 87:
October 17, 2011 (Regular Meeting)P
- Page 88 and 89:
October 17, 2011 (Regular Meeting)P
- Page 90 and 91:
October 17, 2011 (Regular Meeting)P
- Page 92 and 93:
October 17, 2011 (Regular Meeting)P
- Page 94 and 95:
October 17, 2011 (Regular Meeting)P
- Page 96 and 97:
October 17, 2011 (Regular Meeting)P
- Page 98 and 99: October 17, 2011 (Regular Meeting)P
- Page 100 and 101: October 17, 2011 (Regular Meeting)P
- Page 102 and 103: October 17, 2011 (Regular Meeting)P
- Page 104 and 105: October 17, 2011 (Regular Meeting)P
- Page 106 and 107: October 17, 2011 (Regular Meeting)P
- Page 108 and 109: October 17, 2011 (Regular Meeting)P
- Page 110 and 111: October 17, 2011 (Regular Meeting)P
- Page 112 and 113: October 17, 2011 (Regular Meeting)P
- Page 114 and 115: October 17, 2011 (Regular Meeting)P
- Page 116 and 117: October 17, 2011 (Regular Meeting)P
- Page 118 and 119: October 17, 2011 (Regular Meeting)P
- Page 120 and 121: October 17, 2011 (Regular Meeting)P
- Page 122 and 123: October 17, 2011 (Regular Meeting)P
- Page 124 and 125: October 17, 2011 (Regular Meeting)P
- Page 126 and 127: October 17, 2011 (Regular Meeting)P
- Page 128 and 129: October 17, 2011 (Regular Meeting)P
- Page 130 and 131: October 17, 2011 (Regular Meeting)P
- Page 132 and 133: October 17, 2011 (Regular Meeting)P
- Page 134 and 135: October 17, 2011 (Regular Meeting)P
- Page 136 and 137: October 17, 2011 (Regular Meeting)P
- Page 138 and 139: October 17, 2011 (Regular Meeting)P
- Page 140 and 141: October 17, 2011 (Regular Meeting)P
- Page 142 and 143: October 17, 2011 (Regular Meeting)P
- Page 144 and 145: October 17, 2011 (Regular Meeting)P
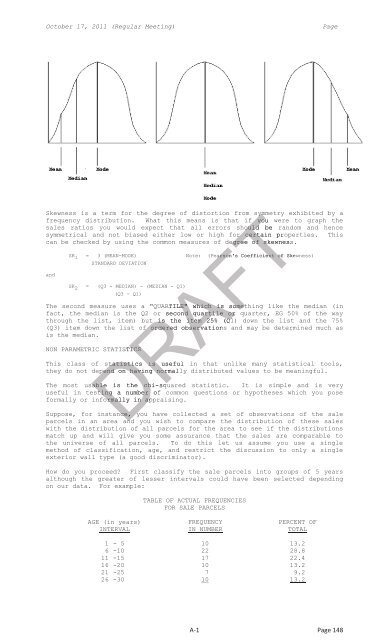
- Page 146 and 147: October 17, 2011 (Regular Meeting)P
- Page 150 and 151: October 17, 2011 (Regular Meeting)P
- Page 152 and 153: October 17, 2011 (Regular Meeting)P
- Page 154 and 155: October 17, 2011 (Regular Meeting)P
- Page 156 and 157: October 17, 2011 (Regular Meeting)P
- Page 158: October 17, 2011 (Regular Meeting)P
- Page 161 and 162: October 17, 2011 (Regular Meeting)P
- Page 163 and 164: October 17, 2011 (Regular Meeting)P
- Page 165 and 166: October 17, 2011 (Regular Meeting)P
- Page 167 and 168: October 17, 2011 (Regular Meeting)P
- Page 169 and 170: October 17, 2011 (Regular Meeting)P
- Page 171: October 17, 2011 (Regular Meeting)P
- Page 175 and 176: October 17, 2011 (Regular Meeting)P
- Page 177 and 178: October 17, 2011 (Regular Meeting)P
- Page 179 and 180: October 17, 2011 (Regular Meeting)P
- Page 181 and 182: October 17, 2011 (Regular Meeting)P
- Page 183 and 184: October 17, 2011 (Regular Meeting)P
- Page 185 and 186: October 17, 2011 (Regular Meeting)P
- Page 187 and 188: October 17, 2011 (Regular Meeting)P
- Page 189 and 190: October 17, 2011 (Regular Meeting)P
- Page 191 and 192: October 17, 2011 (Regular Meeting)P
- Page 193 and 194: October 17, 2011 (Regular Meeting)P
- Page 195 and 196: October 17, 2011 (Regular Meeting)P
- Page 197 and 198: October 17, 2011 (Regular Meeting)P
- Page 199 and 200:
October 17, 2011 (Regular Meeting)P
- Page 201 and 202:
October 17, 2011 (Regular Meeting)P
- Page 203 and 204:
October 17, 2011 (Regular Meeting)P
- Page 205 and 206:
October 17, 2011 (Regular Meeting)P
- Page 207 and 208:
October 17, 2011 (Regular Meeting)P
- Page 209 and 210:
October 17, 2011 (Regular Meeting)P
- Page 211 and 212:
October 17, 2011 (Regular Meeting)P
- Page 213 and 214:
October 17, 2011 (Regular Meeting)P
- Page 215 and 216:
October 17, 2011 (Regular Meeting)P
- Page 217 and 218:
October 17, 2011 (Regular Meeting)P
- Page 219 and 220:
October 17, 2011 (Regular Meeting)P
- Page 221 and 222:
October 17, 2011 (Regular Meeting)P
- Page 223 and 224:
October 17, 2011 (Regular Meeting)P
- Page 225 and 226:
October 17, 2011 (Regular Meeting)P
- Page 227 and 228:
October 17, 2011 (Regular Meeting)P
- Page 229 and 230:
October 17, 2011 (Regular Meeting)P
- Page 231 and 232:
October 17, 2011 (Regular Meeting)P
- Page 233 and 234:
October 17, 2011 (Regular Meeting)P
- Page 235 and 236:
CABARRUS COUNTYBOARD OF COMMISSIONE
- Page 237 and 238:
CABARRUS COUNTYBOARD OF COMMISSIONE
- Page 239 and 240:
CABARRUS COUNTYBOARD OF COMMISSIONE
- Page 241 and 242:
CABARRUS COUNTYBOARD OF COMMISSIONE
- Page 243 and 244:
Attachment number 1F-1Page 243
- Page 245 and 246:
Attachment number 1F-1Page 245
- Page 247 and 248:
Attachment number 1F-1Page 247
- Page 249 and 250:
CABARRUS COUNTYBOARD OF COMMISSIONE
- Page 251 and 252:
STATE OF NORTH CAROLINACOUNTY OF ME
- Page 253 and 254:
2.8. “Operator” means either Ch
- Page 255 and 256:
3.6. Payment of Radio Service Fees.
- Page 257 and 258:
have access to the Radio System ide
- Page 259 and 260:
Phone:704-336-3012Fax:E-Mail: cwhit
- Page 261 and 262:
foregoing, a Force Majeure Event ma
- Page 263 and 264:
ATTESTED:BY:_______________________
- Page 265 and 266:
Exhibit AFCC LicensesSee attached A
- Page 267 and 268:
Exhibit CService Description and Se
- Page 269 and 270:
1.3. Strategic Planning.1.3.1. Desi
- Page 271 and 272:
Service Level for EmergencyService
- Page 273 and 274:
Exhibit DFEES FOR EQUIPMENT MAINTEN
- Page 275 and 276:
Charlotte CIT Support $126,033This
- Page 277 and 278:
Attachment number 2F-2Page 277
- Page 279 and 280:
Attachment number 2F-2Page 279
- Page 281 and 282:
Attachment number 2F-2Page 281
- Page 283 and 284:
Attachment number 2F-2Page 283
- Page 285 and 286:
7. N.C. Gen. Stat. §153A-445 (a)(l
- Page 287 and 288:
10. Governing Law. This Intra-Inter
- Page 289 and 290:
CITY OF KANNAPOLISATTEST:By:By:Name
- Page 291 and 292:
CABARRUS COUNTYBOARD OF COMMISSIONE
- Page 293 and 294:
CABARRUS COUNTYBOARD OF COMMISSIONE
- Page 295 and 296:
Kannapolis City Schools100 DENVER S
- Page 297 and 298:
Attachment number 2F-4Page 297
- Page 299 and 300:
CABARRUS COUNTYBOARD OF COMMISSIONE
- Page 301 and 302:
Office of the County ManagerOctober
- Page 303 and 304:
Attachment number 3F-5Page 303
- Page 305 and 306:
YesCOUNTY MANAGER'S RECOMMENDATIONS
- Page 307 and 308:
BUDGET AMENDMENT:Date: 10/24/2011 A
- Page 309 and 310:
CABARRUS COUNTYBOARD OF COMMISSIONE
- Page 311 and 312:
Attachment number 1F-8Page 311
- Page 313 and 314:
Attachment number 1F-8Page 313
- Page 315 and 316:
Attachment number 1F-8Page 315
- Page 317 and 318:
Attachment number 1F-8Page 317
- Page 319 and 320:
Attachment number 1F-8Page 319
- Page 321 and 322:
Attachment number 1F-8Page 321
- Page 323 and 324:
Attachment number 1F-8Page 323
- Page 325 and 326:
Attachment number 1F-8Page 325
- Page 327 and 328:
Attachment number 1F-8Page 327
- Page 329 and 330:
CABARRUS COUNTYBOARD OF COMMISSIONE
- Page 331 and 332:
Attachment number 1F-9Page 331
- Page 333 and 334:
CABARRUS COUNTYBOARD OF COMMISSIONE
- Page 335 and 336:
Attachment number 1F-10Page 335
- Page 337 and 338:
CABARRUS COUNTYBOARD OF COMMISSIONE
- Page 339 and 340:
Summary of Releases and Refunds for
- Page 341 and 342:
CHAPMAN CALEB SCOTT 2010-555202 C G
- Page 343 and 344:
MANTO JENNIFER LAUREN 2011-569510 P
- Page 345 and 346:
SUPERIOR INDUSTRIAL MAINTENANC 2011
- Page 347 and 348:
ATTACHMENTSProject DescriptionG-1Pa
- Page 349 and 350:
Attachment number 1G-1Page 349
- Page 351 and 352:
CABARRUS COUNTYBOARD OF COMMISSIONE
- Page 353 and 354:
Grant Number 2011-047-19GRANT AGREE
- Page 355 and 356:
Section VI. Independent Status of t
- Page 357 and 358:
Section IX. Subcontracting.A. The G
- Page 359 and 360:
Section XIII. Entire Agreement.A. T
- Page 361 and 362:
Section XVII. Construction.This Agr
- Page 363 and 364:
GRANTEE’s website, news releases,
- Page 365 and 366:
Contribution from Capital Reserve $
- Page 367 and 368:
CABARRUS COUNTYBOARD OF COMMISSIONE
- Page 369 and 370:
Attachment number 1G-3Page 369
- Page 371 and 372:
Attachment number 1G-3Page 371
- Page 373 and 374:
Attachment number 1G-3Page 373
- Page 375 and 376:
Attachment number 1G-3Page 375
- Page 377 and 378:
Attachment number 1G-3Page 377
- Page 379 and 380:
Attachment number 1G-3Page 379
- Page 381 and 382:
Attachment number 1G-3Page 381
- Page 383 and 384:
Attachment number 1G-3Page 383
- Page 385 and 386:
Attachment number 1G-3Page 385
- Page 387 and 388:
Attachment number 1G-3Page 387
- Page 389 and 390:
Attachment number 1G-3Page 389
- Page 391 and 392:
Attachment number 1G-3Page 391
- Page 393 and 394:
Attachment number 1G-3Page 393
- Page 395 and 396:
Attachment number 1G-3Page 395
- Page 397 and 398:
Attachment number 1G-3Page 397
- Page 399 and 400:
CABARRUS COUNTYBOARD OF COMMISSIONE
- Page 401 and 402:
ADULT CARE HOME COMMUNITY ADVISORY
- Page 403 and 404:
Adult Care Home Community Advisory
- Page 405 and 406:
ATTACHMENTSRosterApplications on Fi
- Page 407 and 408:
NURSING HOME COMMUNITY ADVISORY COM
- Page 409 and 410:
Dashboard Report for Cabarrus Count
- Page 411 and 412:
Dashboard Report for Cabarrus Count
- Page 413 and 414:
Dashboard Report for Cabarrus Count
- Page 415 and 416:
CABARRUS COUNTYBOARD OF COMMISSIONE
- Page 417 and 418:
30 Director's salary as of July 1,
- Page 419 and 420:
100 Grand Total Circulation: Branch
- Page 421 and 422:
152 Public Service Hours Per Year15
- Page 423 and 424:
CABARRUS COUNTYBOARD OF COMMISSIONE
- Page 425 and 426:
Table of Contents1. Introduction ..
- Page 427 and 428:
Review of Major Milestones for theC
- Page 429 and 430:
The themes generated from this exer
- Page 431 and 432:
Soft skills needed )nternal Assessm
- Page 433 and 434:
VisioningNext, participants were in
- Page 435 and 436:
3. Recreational4. Policy revisions
- Page 437 and 438:
Mission StatementThe CSLE separated
- Page 439 and 440:
CABARRUS COUNTYBOARD OF COMMISSIONE
- Page 441 and 442:
1 MinuteSUBMITTED BY:Kay Honeycutt,
- Page 443 and 444:
some or all of that spending from o
- Page 445 and 446:
V-8 STMAY STDAKOTA STS RIDGE AVECON
- Page 447 and 448:
Office Use OnlyDATE RECEIVED:Applic
- Page 449 and 450:
Attachment number 5I-5Page 449
- Page 451 and 452:
CABARRUS COUNTYBOARD OF COMMISSIONE