- Page 1 and 2:
DraftAnnual Accounts and Reportas a
- Page 4 and 5:
C O N T E N T SConsolidated Account
- Page 6 and 7:
Page no.* * *Extraordinary business
- Page 8:
CONSOLIDATED ACCOUNTS
- Page 11 and 12:
— Retail and private banking (RPB
- Page 13 and 14:
DEVELOPMENTS IN CAPITAL MARKETSIn t
- Page 15 and 16:
comparing total assets with tangibl
- Page 17 and 18:
The market capitalization of listed
- Page 20 and 21:
RESTATED BALANCE SHEET30/6/10 30/6/
- Page 22 and 23:
30 June 2010Corporate &InvestmentBa
- Page 24 and 25:
Impaired assets (i.e. non-performin
- Page 26 and 27:
upward adjustments to reflect amort
- Page 28 and 29:
An updated list of the properties o
- Page 30 and 31:
12 mths to 30/6/10 12 mths to 30/6/
- Page 32 and 33:
Corporate and Investment Banking30
- Page 34 and 35:
This division reported a net profit
- Page 36 and 37:
Equity investments and AFS shares
- Page 38 and 39:
Mediobanca International (Luxembour
- Page 40 and 41:
Principal investing12 mths to 30/6/
- Page 42 and 43:
Retail and private bankingb12 mths
- Page 44 and 45:
A breakdown of this division’s re
- Page 46 and 47:
New loans for the twelve months tot
- Page 48 and 49:
Private banking30 June 2010CMB Banc
- Page 50 and 51:
transmission, investment advice and
- Page 52 and 53:
OTHER INFORMATIONRelated party disc
- Page 54 and 55:
Reconciliation of shareholders’ e
- Page 56 and 57:
AUDITORS’ REPORT
- Page 58 and 59:
CONSOLIDATED FINANCIAL STATEMENTS
- Page 60 and 61:
Liabilities and net equity30/6/11 3
- Page 62 and 63:
CONSOLIDATED COMPREHENSIVE PROFIT A
- Page 64 and 65:
STATEMENT OF CHANGES TO NET EQUITY
- Page 66 and 67:
RECONCILIATION OF MOVEMENTS IN CASH
- Page 68 and 69:
Page no.Part C -Notes to consolidat
- Page 70 and 71:
Sectction 3Area and methods of cons
- Page 72 and 73:
Section 4Significant accounting pol
- Page 74 and 75:
Assets are tested for impairment at
- Page 76 and 77:
HedgesThere are two types of hedge:
- Page 78 and 79:
and its related value of use, and a
- Page 80 and 81:
Staff severance indemnity provision
- Page 82 and 83:
Dividends and commissionsThese are
- Page 84 and 85:
A.3.2Fair value rankingA.3.2.1 Asse
- Page 86 and 87:
A.3.2.3 Annual changes in financial
- Page 88 and 89:
Section 2Heading 20: Financial asse
- Page 90 and 91:
2.3 Financial assets held for tradi
- Page 92 and 93:
4.3 AFS securities: assets subject
- Page 94 and 95:
5.2 Assets held to maturity: by bor
- Page 96 and 97:
Section 7Heading 70: Due from custo
- Page 98 and 99:
Section 8Heading 80: Hedging deriva
- Page 100 and 101:
Section 10Heading 100: Equity inves
- Page 102 and 103:
The book value of the investment in
- Page 104 and 105:
Section 12Heading 120: Property, pl
- Page 106 and 107:
12.4 Tangible assets held for inves
- Page 108 and 109:
13.2 Intangible assets: movements d
- Page 110 and 111:
14.4 Changes in deferred tax during
- Page 112 and 113:
14.6 Changes in deferred tax during
- Page 114 and 115:
LiabilitiesSection 1Heading 10: Due
- Page 116 and 117:
Section 3Heading 30: Debt securitie
- Page 118 and 119:
Section 6Heading 60: Hedging deriva
- Page 120 and 121:
Section 11Heading 110: Staff severa
- Page 122 and 123:
Section 13Heading 130: Technical re
- Page 124 and 125:
Section 16Heading 210: Net equity a
- Page 126 and 127:
PART C - NOTES TO CONSOLIDATEDPROFI
- Page 128 and 129:
Section 2Headings 40 and 50: Net fe
- Page 130 and 131:
Section 4Heading 80: Net trading in
- Page 132 and 133:
Section 6Heading 100: Gains (losses
- Page 134 and 135:
8.3 Adjustments for impairment to f
- Page 136 and 137:
Section 10Heading 160: Income less
- Page 138 and 139:
Section 11Heading 180: Administrati
- Page 140 and 141:
Section 12Heading 190: 1Net transfe
- Page 142 and 143:
Section 16Heading 240: Gains (losse
- Page 144 and 145:
20.2 Reconciliation between theoret
- Page 146 and 147:
PART D - CONSOLIDATED COMPREHENSIVE
- Page 148 and 149:
Corporate banking (Mediobanca)The G
- Page 150 and 151:
QUANTITATIVE INFORMATIONCREDIT QUAL
- Page 152 and 153:
A.1.2.a Exposures to sovereign debt
- Page 154 and 155:
A.1.5Cash exposures to banks: trend
- Page 156 and 157:
A.1.8Banking Group - cash exposures
- Page 158 and 159:
A.3 Secured exposures by type of se
- Page 160 and 161:
B. Loan distribution and concentrat
- Page 162 and 163:
B.3 Banking Group - cash and off-ba
- Page 164 and 165:
C. Securitizations and asset dispos
- Page 166 and 167:
Quantitative informationC.1.1Bankin
- Page 168 and 169:
C.1.4Banking Group - exposures to s
- Page 170 and 171:
C.1.7Banking Group - servicing: col
- Page 172 and 173: Under the terms of the sale contrac
- Page 174 and 175: C.2.2Banking Group - financial liab
- Page 176 and 177: QUANTITATIVE INFORMATIONThis year h
- Page 178 and 179: Table 2: Value at risk and expected
- Page 180 and 181: QUANTITATIVE INFORMATION1. Regulato
- Page 182 and 183: Currency of denomination: OTHERType
- Page 184 and 185: 1.2.2 INTEREST RATE RISK AND PRICE
- Page 186 and 187: the Bank’s various bodies was app
- Page 188 and 189: Currency of denomination: US DOLLAR
- Page 190 and 191: 2. Regulatory trading book: cash ex
- Page 192 and 193: QUANTITATIVE INFORMATION1. Assets,
- Page 194 and 195: A.2.A.2.1Banking book: average and
- Page 196 and 197: A.3 OTC financial derivatives: posi
- Page 198 and 199: A.5 OTC financial derivatives: trad
- Page 200 and 201: A.7 OTC financial derivatives: bank
- Page 202 and 203: A.9 OTC financial derivatives by ma
- Page 204 and 205: B.2 OTC credit derivatives: gross p
- Page 206 and 207: B.5 OTC credit derivatives: gross p
- Page 208 and 209: 1.3 BANKING GROUP: LIQUIDITY RISKQU
- Page 210 and 211: Currency of denomination: US DOLLAR
- Page 212 and 213: 1.4 BANKING GROUP - OPERATING RISKQ
- Page 214 and 215: PART F - INFORMATION ON CONSOLIDATE
- Page 216 and 217: B.3 AFS valuation reserves: movemen
- Page 218 and 219: 2.2 Regulatory capital requirements
- Page 220 and 221: B. Quantitative informainformationC
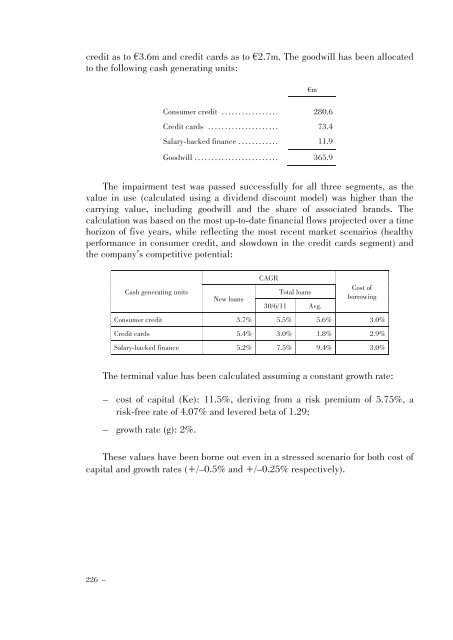
- Page 224 and 225: Situation at 30 June 2011Directors,
- Page 226 and 227: Subsequent to the reporting date, o
- Page 228 and 229: PART L - SEGMENT REPORTINGA. PRIMAR
- Page 230 and 231: B. SECONDARY SEGMENT REPORTINGB.1 P
- Page 232 and 233: ANNUALGENERALMEETING28 OCTOBER 2011
- Page 234 and 235: Ordinary businessACCOUNTS OF THE BA
- Page 236 and 237: Provisions for financial assets inc
- Page 238 and 239: RESTATED BALANCE SHEET 30/6/10 30/6
- Page 240 and 241: Loans and advances to Group compani
- Page 242 and 243: Cash and bank balances include €1
- Page 244 and 245: current prices). Further explanatio
- Page 246 and 247: — Furniture and intangible assets
- Page 248 and 249: Net fee and commission incomeThis h
- Page 250 and 251: — the court of appeals in Milan h
- Page 252 and 253: esearch project on medium-sized Eur
- Page 254 and 255: Declaration in respect of individua
- Page 256 and 257: STATUTORY AUDIT COMMITTEE’S REPOR
- Page 258 and 259: vii)Finance Act, in the course of w
- Page 260 and 261: Type of serviceRecontaErnst & Young
- Page 262 and 263: The Statutory Audit Committee ascer
- Page 264 and 265: AUDITORS’ REPORT
- Page 266 and 267: INDIVIDUAL FINANCIAL STATEMENTS *(*
- Page 268 and 269: Liabilities and net equity30/6/11 3
- Page 270 and 271: COMPREHENSIVE PROFIT AND LOSS ACCOU
- Page 272 and 273:
STATEMENT OF CHANGES TO MEDIOBANCA
- Page 274 and 275:
RECONCILIATION OF MOVEMENTS IN CASH
- Page 276 and 277:
Page no.Part C - Notes to profit an
- Page 278 and 279:
Section 3Significant accounting pol
- Page 280 and 281:
Assets are tested for impairment at
- Page 282 and 283:
- cash flow hedges, which are inten
- Page 284 and 285:
Goodwill may be recognized where th
- Page 286 and 287:
All actuarial profits and/or losses
- Page 288 and 289:
Related parties (IAS 24)In accordan
- Page 290 and 291:
A.3.2A.3.2.1Fair value rankingAsset
- Page 292 and 293:
A.3.2.3 Annual changes in financial
- Page 294 and 295:
Section 2Heading 20: Financial asse
- Page 296 and 297:
2.3 Financial assets held for tradi
- Page 298 and 299:
4.4 AFS securities: movements durin
- Page 300 and 301:
Section 6Heading 60 - Due from bank
- Page 302 and 303:
7.2 Due from customers: by borrower
- Page 304 and 305:
Section 10Heading 100: Equity inves
- Page 306 and 307:
Significant data 1Total assetsTotal
- Page 308 and 309:
Section 11Heading 110: Property pla
- Page 310 and 311:
11.4 Tangible assets held for inves
- Page 312 and 313:
12.2 Core intangible assets: moveme
- Page 314 and 315:
13.4 Changes in deferred tax during
- Page 316 and 317:
Section 15Heading 150: Other assets
- Page 318 and 319:
Section 3Heading 30: Debt securitie
- Page 320 and 321:
Section 6Heading 60: Hedging deriva
- Page 322 and 323:
Section 11Heading 110: Staff severa
- Page 324 and 325:
14.2 Share capital: changes in no.
- Page 326 and 327:
Other information1. Guarantees and
- Page 328 and 329:
PART C - NOTES TO PROFIT AND LOSS A
- Page 330 and 331:
Section 2Headings 40 and 50: Net fe
- Page 332 and 333:
Section 3Heading 70: Dividends and
- Page 334 and 335:
Section 5Heading 90: Net hedging in
- Page 336 and 337:
Section 8Heading 130: Adjustments f
- Page 338 and 339:
Section 9Heading 150: Administrativ
- Page 340 and 341:
Section 11Heading 170: Net adjustme
- Page 342 and 343:
Section 17Heading 240: Net gain (lo
- Page 344 and 345:
PART D - COMPREHENSIVE PROFIT AND L
- Page 346 and 347:
1. General aspectsThe Bank’s inte
- Page 348 and 349:
A.1.2 Financial assets by portfolio
- Page 350 and 351:
A.1.2. b Exposures to sovereign deb
- Page 352 and 353:
A.1.6 Cash and off-balance-sheet ex
- Page 354 and 355:
A.3 Secured exposures by type of se
- Page 356 and 357:
B. Loan distribution and concentrat
- Page 358 and 359:
B.3 Cash and off-balance-sheet expo
- Page 360 and 361:
C. Securitizations and asset dispos
- Page 362 and 363:
Quantitative informationC.1.1Exposu
- Page 364 and 365:
C.1.4 Exposures to securitizations
- Page 366 and 367:
C.2 Asset disposalsC.2.1 Financial
- Page 368 and 369:
Section 2Market risk2.1 INTEREST RA
- Page 370 and 371:
Table 1 - Value at risk and expecte
- Page 372 and 373:
Trend in VaR constituents The
- Page 374 and 375:
Currency of denomination: US DOLLAR
- Page 376 and 377:
2.1 Regulatory trading book: cash e
- Page 378 and 379:
HedgingFair value hedgesFair value
- Page 380 and 381:
Currency of denomination: US DOLLAR
- Page 382 and 383:
2. Banking book: cash exposures of
- Page 384 and 385:
2.4 FINANCIAL DERIVATIVE PRODUCTSA.
- Page 386 and 387:
A.2.2Other derivativesType of trans
- Page 388 and 389:
A.4 Financial derivatives: negative
- Page 390 and 391:
A.6 OTC financial derivatives: trad
- Page 392 and 393:
A.8 OTC financial derivatives: bank
- Page 394 and 395:
B. CREDIT DERIVATIVESB.1 Credit der
- Page 396 and 397:
B.4 OTC credit derivatives: gross p
- Page 398 and 399:
C. CREDIT AND FINANCIAL DERIVATIVES
- Page 400 and 401:
indicator generated for the Bank of
- Page 402 and 403:
Currency of denomination: US DOLLAR
- Page 404 and 405:
Section 4Operating riskDefinitionOp
- Page 406 and 407:
B.2 AFS valuation reserves: composi
- Page 408 and 409:
A. QUALITATIVE INFORMATIONTier 1 ca
- Page 410 and 411:
PART H - RELATED PARTY DISCLOSURE1.
- Page 412 and 413:
BENEFICIAL INTEREST OF BOARD MEMBER
- Page 414 and 415:
Situation at 30 June 2011Groupcompa
- Page 416 and 417:
Subsequent to the reporting date, o
- Page 418 and 419:
ANNEXES
- Page 420 and 421:
Liabilities and net equityIAS-compl
- Page 422 and 423:
MEDIOBANCA S.p.A. BALANCE SHEET *As
- Page 424 and 425:
MEDIOBANCA S.p.A. PROFIT AND LOSS A
- Page 426 and 427:
BANKS AND FINANCIAL COMPANIES (IAS/
- Page 428 and 429:
BANKS AND FINANCIAL COMPANIES (IAS/
- Page 430 and 431:
BANKS AND FINANCIAL COMPANIES (IAS/
- Page 432 and 433:
BANKS AND FINANCIAL COMPANIES (IAS/
- Page 434 and 435:
BANKSTABLE B (cont.)BALANCE SHEETSC
- Page 436 and 437:
OTHER GROUP COMPANIESTABLE B (cont.
- Page 438 and 439:
OTHER FINANCIAL COMPANIES (IAS/IFRS
- Page 440 and 441:
OTHER FINANCIAL COMPANIES (IAS/IFRS
- Page 442 and 443:
OTHER NON-FINANCIAL UNDERTAKINGS (I
- Page 444 and 445:
OTHER NON-FINANCIAL UNDERTAKINGS (I
- Page 446 and 447:
OTHERS (IAS/IFRS)TABLE B (cont.)462
- Page 448 and 449:
ASSOCIATE COMPANIESTABLE CBALANCE S
- Page 450 and 451:
ASSOCIATE COMPANIES TABLE C (cont.
- Page 452 and 453:
OTHER ASSOCIATED UNDERTAKINGSTABLE
- Page 454 and 455:
OTHER ASSOCIATED UNDERTAKINGSTABLE
- Page 456 and 457:
OTHER ASSOCIATED UNDERTAKINGSTABLE
- Page 458 and 459:
OTHER ASSOCIATED UNDERTAKINGSTABLE
- Page 460 and 461:
OTHER ASSOCIATED UNDERTAKINGSTABLE
- Page 462 and 463:
TABLE DSIGNIFICANT EQUITY INVESTMEN
- Page 464 and 465:
TABLE D (cont.)Sharecapital€mPar
- Page 466 and 467:
APPOINTMENT OF MEMBERS OF BOARD OF
- Page 468 and 469:
APPOINTMENT OF MEMBERS AND CHAIRMAN
- Page 470 and 471:
REPORT ON STAFF REMUNERATION POLICI
- Page 472 and 473:
. Criteria for calculation of bonus
- Page 474 and 475:
Restrictions have also been introdu
- Page 476 and 477:
ANNEXThe tables below shows the str
- Page 478 and 479:
II. Organizational governanceThe pr
- Page 480 and 481:
The typical components of remunerat
- Page 482 and 483:
- appraisal of the Mediobanca share
- Page 484 and 485:
the Bank, valuation criteria linked
- Page 486 and 487:
At a Board meeting held on 24 June
- Page 488 and 489:
l. Other informationCaps on variabl
- Page 490 and 491:
- in the area of related parties, t
- Page 492 and 493:
compliance with the terms and proce
- Page 494 and 495:
SECTION IIIGeneral MeetingsArticle
- Page 496 and 497:
general meeting or otherwise requir
- Page 498 and 499:
specified in the notice of general
- Page 500 and 501:
eing replaced had been elected from
- Page 502 and 503:
3) decisions concerning the acquisi
- Page 504 and 505:
transaction concerned, either thems
- Page 506 and 507:
Article 17, paragraph 2, points 3 a
- Page 508 and 509:
for its operations and the size of
- Page 510 and 511:
specifically designated by the Boar
- Page 512 and 513:
The proposals for appointments are
- Page 514 and 515:
Article 29The Statutory Audit Commi
- Page 516 and 517:
AUTHORIZATION TO THE BOARD OF DIREC
- Page 518 and 519:
The share capital may also be incre
- Page 520 and 521:
The Board of Directors is also auth
- Page 522 and 523:
ANNUAL STATEMENT SON CORPORATE GOVE
- Page 524 and 525:
At a general meeting held on 28 Oct
- Page 526 and 527:
Persons authorized to take part and
- Page 528 and 529:
All the Directors have made stateme
- Page 530 and 531:
DIRECTORSIRECTORS’ AND STRATEGIC
- Page 532 and 533:
With reference to risk management,
- Page 534 and 535:
Appointments committeeAppointments
- Page 536 and 537:
The Executive Committee is currentl
- Page 538 and 539:
HEAD OF COMPANY FINANCIAL REPORTING
- Page 540 and 541:
- expresses its opinion on the appo
- Page 542 and 543:
INTERNAL DEALINGThe Directors of Me
- Page 544 and 545:
In performing his duties, the head
- Page 546 and 547:
RISK MANAGEMENT AND INTERNAL ICONTR
- Page 548 and 549:
Table 1: BOARD OFMember ****OARD OF
- Page 550 and 551:
Table 3:3: OTHER REQUIREMENTS UNDER
- Page 552 and 553:
NamePosition held inMediobancaPosts
- Page 554:
NamePosition held inMediobancaPosts