ARE YOU ON THE RIGHT TRACK? - Rutgers WPF
ARE YOU ON THE RIGHT TRACK? - Rutgers WPF
ARE YOU ON THE RIGHT TRACK? - Rutgers WPF
- No tags were found...

You also want an ePaper? Increase the reach of your titles
YUMPU automatically turns print PDFs into web optimized ePapers that Google loves.
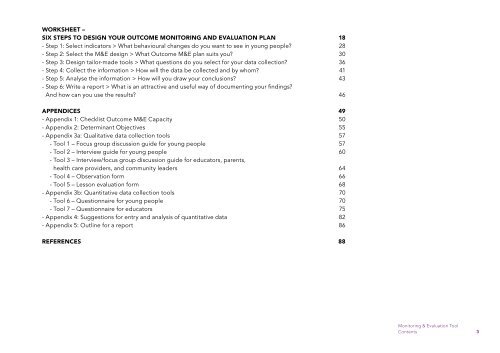
WORKSHEET –SIX STEPS TO DESIGN <strong>YOU</strong>R OUTCOME M<strong>ON</strong>ITORING AND EVALUATI<strong>ON</strong> PLAN 18- Step 1: Select indicators > What behavioural changes do you want to see in young people? 28- Step 2: Select the M&E design > What Outcome M&E plan suits you? 30- Step 3: Design tailor-made tools > What questions do you select for your data collection? 36- Step 4: Collect the information > How will the data be collected and by whom? 41- Step 5: Analyse the information > How will you draw your conclusions? 43- Step 6: Write a report > What is an attractive and useful way of documenting your findings?And how can you use the results? 46APPENDICES49- Appendix 1: Checklist Outcome M&E Capacity 50- Appendix 2: Determinant Objectives 55- Appendix 3a: Qualitative data collection tools 57- Tool 1 – Focus group discussion guide for young people 57- Tool 2 – Interview guide for young people 60- Tool 3 – Interview/focus group discussion guide for educators, parents,health care providers, and community leaders 64- Tool 4 – Observation form 66- Tool 5 – Lesson evaluation form 68- Appendix 3b: Quantitative data collection tools 70- Tool 6 – Questionnaire for young people 70- Tool 7 – Questionnaire for educators 75- Appendix 4: Suggestions for entry and analysis of quantitative data 82- Appendix 5: Outline for a report 86references88Monitoring & Evaluation ToolContents 3