ARE YOU ON THE RIGHT TRACK? - Rutgers WPF
ARE YOU ON THE RIGHT TRACK? - Rutgers WPF
ARE YOU ON THE RIGHT TRACK? - Rutgers WPF
- No tags were found...

Create successful ePaper yourself
Turn your PDF publications into a flip-book with our unique Google optimized e-Paper software.
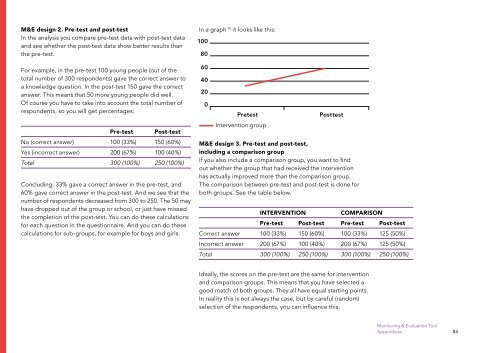
M&E design 2. Pre-test and post-testIn the analysis you compare pre-test data with post-test dataand see whether the post-test data show better results thanthe pre-test.For example, in the pre-test 100 young people (out of thetotal number of 300 respondents) gave the correct answer toa knowledge question. In the post-test 150 gave the correctanswer. This means that 50 more young people did well.Of course you have to take into account the total number ofrespondents, so you will get percentages:No (correct answer)Yes (incorrect answer)TotalPre-test100 (33%)200 (67%)300 (100%)Post-test150 (60%)100 (40%)250 (100%)Concluding: 33% gave a correct answer in the pre-test, and60% gave correct answer in the post-test. And we see that thenumber of respondents decreased from 300 to 250. The 50 mayhave dropped out of the group or school, or just have missedthe completion of the post-test. You can do these calculationsfor each question in the questionnaire. And you can do thesecalculations for sub-groups, for example for boys and girls.In a graph 10 it looks like this:100806040200PretestIntervention groupM&E design 3. Pre-test and post-test,including a comparison groupIf you also include a comparison group, you want to findout whether the group that had received the interventionhas actually improved more than the comparison group.The comparison between pre-test and post-test is done forboth groups. See the table below.Correct answerIncorrect answerTotalINTERVENTI<strong>ON</strong>Pre-test Post-test100 (33%) 150 (60%)200 (67%) 100 (40%)300 (100%) 250 (100%)PosttestCOMPARIS<strong>ON</strong>Pre-test Post-test100 (33%) 125 (50%)200 (67%) 125 (50%)300 (100%) 250 (100%)Ideally, the scores on the pre-test are the same for interventionand comparison groups. This means that you have selected agood match of both groups. They all have equal starting points.In reality this is not always the case, but by careful (random)selection of the respondents, you can influence this.Monitoring & Evaluation ToolAppendices 84