ARE YOU ON THE RIGHT TRACK? - Rutgers WPF
ARE YOU ON THE RIGHT TRACK? - Rutgers WPF
ARE YOU ON THE RIGHT TRACK? - Rutgers WPF
- No tags were found...

You also want an ePaper? Increase the reach of your titles
YUMPU automatically turns print PDFs into web optimized ePapers that Google loves.
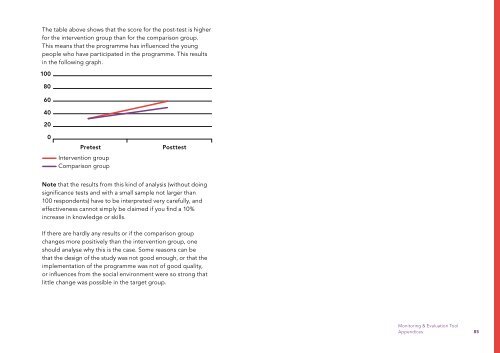
The table above shows that the score for the post-test is higherfor the intervention group than for the comparison group.This means that the programme has influenced the youngpeople who have participated in the programme. This resultsin the following graph.100806040200PretestIntervention groupComparison groupPosttestNote that the results from this kind of analysis (without doingsignificance tests and with a small sample not larger than100 respondents) have to be interpreted very carefully, andeffectiveness cannot simply be claimed if you find a 10%increase in knowledge or skills.If there are hardly any results or if the comparison groupchanges more positively than the intervention group, oneshould analyse why this is the case. Some reasons can bethat the design of the study was not good enough, or that theimplementation of the programme was not of good quality,or influences from the social environment were so strong thatlittle change was possible in the target group.Monitoring & Evaluation ToolAppendices 85