Mechanisms of aluminium neurotoxicity in oxidative stress-induced ...
Mechanisms of aluminium neurotoxicity in oxidative stress-induced ...
Mechanisms of aluminium neurotoxicity in oxidative stress-induced ...
Create successful ePaper yourself
Turn your PDF publications into a flip-book with our unique Google optimized e-Paper software.
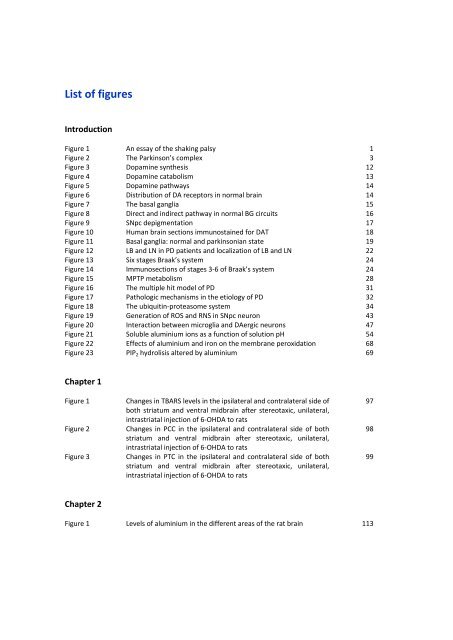
List <strong>of</strong> figures<br />
Introduction<br />
Figure 1 An essay <strong>of</strong> the shak<strong>in</strong>g palsy 1<br />
Figure 2 The Park<strong>in</strong>son’s complex 3<br />
Figure 3 Dopam<strong>in</strong>e synthesis 12<br />
Figure 4 Dopam<strong>in</strong>e catabolism 13<br />
Figure 5 Dopam<strong>in</strong>e pathways 14<br />
Figure 6 Distribution <strong>of</strong> DA receptors <strong>in</strong> normal bra<strong>in</strong> 14<br />
Figure 7 The basal ganglia 15<br />
Figure 8 Direct and <strong>in</strong>direct pathway <strong>in</strong> normal BG circuits 16<br />
Figure 9 SNpc depigmentation 17<br />
Figure 10 Human bra<strong>in</strong> sections immunosta<strong>in</strong>ed for DAT 18<br />
Figure 11 Basal ganglia: normal and park<strong>in</strong>sonian state 19<br />
Figure 12 LB and LN <strong>in</strong> PD patients and localization <strong>of</strong> LB and LN 22<br />
Figure 13 Six stages Braak’s system 24<br />
Figure 14 Immunosections <strong>of</strong> stages 3-6 <strong>of</strong> Braak’s system 24<br />
Figure 15 MPTP metabolism 28<br />
Figure 16 The multiple hit model <strong>of</strong> PD 31<br />
Figure 17 Pathologic mechanisms <strong>in</strong> the etiology <strong>of</strong> PD 32<br />
Figure 18 The ubiquit<strong>in</strong>-proteasome system 34<br />
Figure 19 Generation <strong>of</strong> ROS and RNS <strong>in</strong> SNpc neuron 43<br />
Figure 20 Interaction between microglia and DAergic neurons 47<br />
Figure 21 Soluble <strong>alum<strong>in</strong>ium</strong> ions as a function <strong>of</strong> solution pH 54<br />
Figure 22 Effects <strong>of</strong> <strong>alum<strong>in</strong>ium</strong> and iron on the membrane peroxidation 68<br />
Figure 23 PIP2 hydrolisis altered by <strong>alum<strong>in</strong>ium</strong> 69<br />
Chapter 1<br />
Figure 1 Changes <strong>in</strong> TBARS levels <strong>in</strong> the ipsilateral and contralateral side <strong>of</strong><br />
both striatum and ventral midbra<strong>in</strong> after stereotaxic, unilateral,<br />
<strong>in</strong>trastriatal <strong>in</strong>jection <strong>of</strong> 6-OHDA to rats<br />
Figure 2 Changes <strong>in</strong> PCC <strong>in</strong> the ipsilateral and contralateral side <strong>of</strong> both<br />
striatum and ventral midbra<strong>in</strong> after stereotaxic, unilateral,<br />
<strong>in</strong>trastriatal <strong>in</strong>jection <strong>of</strong> 6-OHDA to rats<br />
Figure 3 Changes <strong>in</strong> PTC <strong>in</strong> the ipsilateral and contralateral side <strong>of</strong> both<br />
striatum and ventral midbra<strong>in</strong> after stereotaxic, unilateral,<br />
<strong>in</strong>trastriatal <strong>in</strong>jection <strong>of</strong> 6-OHDA to rats<br />
Chapter 2<br />
Figure 1 Levels <strong>of</strong> <strong>alum<strong>in</strong>ium</strong> <strong>in</strong> the different areas <strong>of</strong> the rat bra<strong>in</strong> 113<br />
97<br />
98<br />
99


