For further information regarding Goodwill and Intangible assets,see Note 18 to the Consolidated Financial Statements. For furtherinformation on Brokerage receivables, see Note 13 to the ConsolidatedFinancial Statements.DepositsDeposits represent customer funds that are payable on demand orupon maturity. For a discussion of deposits, see “Capital Resources andLiquidity—Funding and Liquidity” below.DebtDebt is composed of both short-term and long-term borrowings. Long-termborrowings include senior notes, subordinated notes, trust preferred securitiesand securitizations. Short-term borrowings include commercial paper andborrowings from unaffiliated banks and other market participants. During2010, total debt increased by $27 billion, or 6%, including the consolidationof securitizations as a result of the adoption of SFAS 166/167 effectiveJanuary 1, 2010. Absent the impact of SFAS 166/167, total debt decreased by$57 billion, or 13%. For further information on long-term and short-termdebt, see “Capital Resources and Liquidity—Funding and Liquidity” belowand Note 19 to the Consolidated Financial Statements.Other LiabilitiesOther liabilities consists of Brokerage payables and Other liabilities aspresented on the Consolidated Balance Sheet (including, among otheritems, accrued expenses and other payables, deferred tax liabilities, end-userderivatives in a net payable position, and reserves for legal claims, taxes,restructuring reserves for unfunded lending commitments, and othermatters). During 2010, Other liabilities decreased $17 billion, or 12%,primarily due to a $9 billion decrease in brokerage payables and a $7 billiondecrease in other liabilities.For further information regarding Brokerage Payables, see Note 13 to theConsolidated Financial Statements.56
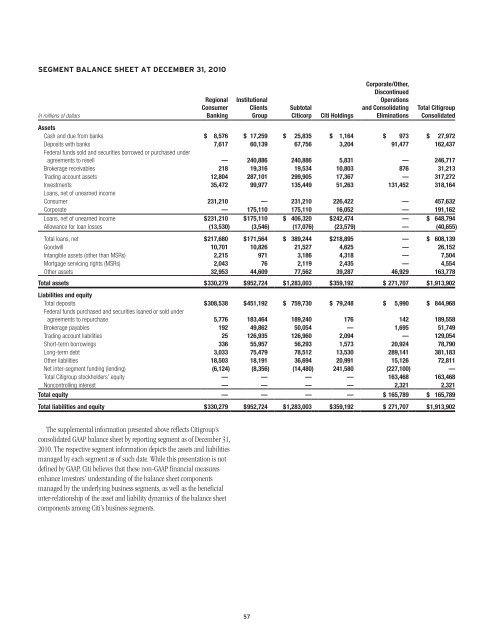
SEGMENT BALANCE SHEET AT DECEMBER 31, 2010In millions of dollarsRegionalConsumerBankingInstitutionalClientsGroupSubtotalCiticorpCiti HoldingsCorporate/Other,DiscontinuedOperationsand ConsolidatingEliminationsTotal <strong>Citigroup</strong>ConsolidatedAssetsCash and due from banks $ 8,576 $ 17,259 $ 25,835 $ 1,164 $ 973 $ 27,972Deposits with banks 7,617 60,139 67,756 3,204 91,477 162,437Federal funds sold and securities borrowed or purchased underagreements to resell — 240,886 240,886 5,831 — 246,717Brokerage receivables 218 19,316 19,534 10,803 876 31,213Trading account assets 12,804 287,101 299,905 17,367 — 317,272Investments 35,472 99,977 135,449 51,263 131,452 318,164Loans, net of unearned incomeConsumer 231,210 — 231,210 226,422 — 457,632Corporate — 175,110 175,110 16,052 — 191,162Loans, net of unearned income $231,210 $175,110 $ 406,320 $242,474 — $ 648,794Allowance for loan losses (13,530) (3,546) (17,076) (23,579) — (40,655)Total loans, net $217,680 $171,564 $ 389,244 $218,895 — $ 608,139Goodwill 10,701 10,826 21,527 4,625 — 26,152Intangible assets (other than MSRs) 2,215 971 3,186 4,318 — 7,504Mortgage servicing rights (MSRs) 2,043 76 2,119 2,435 — 4,554Other assets 32,953 44,609 77,562 39,287 46,929 163,778Total assets $330,279 $952,724 $1,283,003 $359,192 $ 271,707 $1,913,902Liabilities and equityTotal deposits $308,538 $451,192 $ 759,730 $ 79,248 $ 5,990 $ 844,968Federal funds purchased and securities loaned or sold underagreements to repurchase 5,776 183,464 189,240 176 142 189,558Brokerage payables 192 49,862 50,054 — 1,695 51,749Trading account liabilities 25 126,935 126,960 2,094 — 129,054Short-term borrowings 336 55,957 56,293 1,573 20,924 78,790Long-term debt 3,033 75,479 78,512 13,530 289,141 381,183Other liabilities 18,503 18,191 36,694 20,991 15,126 72,811Net inter-segment funding (lending) (6,124) (8,356) (14,480) 241,580 (227,100) —Total <strong>Citigroup</strong> stockholders’ equity — — — — 163,468 163,468Noncontrolling interest — — — — 2,321 2,321Total equity — — — — $ 165,789 $ 165,789Total liabilities and equity $330,279 $952,724 $1,283,003 $359,192 $ 271,707 $1,913,902The supplemental information presented above reflects <strong>Citigroup</strong>’sconsolidated GAAP balance sheet by reporting segment as of December 31,2010. The respective segment information depicts the assets and liabilitiesmanaged by each segment as of such date. While this presentation is notdefined by GAAP, Citi believes that these non-GAAP financial measuresenhance investors’ understanding of the balance sheet componentsmanaged by the underlying business segments, as well as the beneficialinter-relationship of the asset and liability dynamics of the balance sheetcomponents among Citi’s business segments.57
- Page 1 and 2: UNITED STATESSECURITIES AND EXCHANG
- Page 3 and 4: CITIGROUP’S 2010 ANNUAL REPORT ON
- Page 5 and 6: As described above, Citigroup is ma
- Page 7 and 8: Operating ExpensesCitigroup operati
- Page 9 and 10: FIVE-YEAR SUMMARY OF SELECTED FINAN
- Page 11 and 12: CITIGROUP REVENUESIn millions of do
- Page 13 and 14: REGIONAL CONSUMER BANKINGRegional C
- Page 15 and 16: 2009 vs. 2008Revenues, net of inter
- Page 17 and 18: 2009 vs. 2008Revenues, net of inter
- Page 19 and 20: 2009 vs. 2008Revenues, net of inter
- Page 21 and 22: 2009 vs. 2008Revenues, net of inter
- Page 23 and 24: SECURITIES AND BANKINGSecurities an
- Page 25 and 26: TRANSACTION SERVICESTransaction Ser
- Page 27 and 28: BROKERAGE AND ASSET MANAGEMENTBroke
- Page 29 and 30: Japan Consumer FinanceCitigroup con
- Page 31 and 32: The following table provides detail
- Page 33 and 34: CORPORATE/OTHERCorporate/Other incl
- Page 35: During 2010, average Consumer loans
- Page 39 and 40: Citigroup Regulatory Capital Ratios
- Page 41 and 42: Capital Resources of Citigroup’s
- Page 43 and 44: Regulatory Capital Standards Develo
- Page 45 and 46: DepositsCiti continues to focus on
- Page 47 and 48: Secured financing is primarily cond
- Page 49 and 50: Each of the credit rating agencies
- Page 51 and 52: RISK FACTORSThe ongoing implementat
- Page 53 and 54: The emerging markets in which Citi
- Page 55 and 56: is largely uncertain. However, any
- Page 57 and 58: a short-term Liquidity Coverage Rat
- Page 59 and 60: understanding or cause confusion ac
- Page 61 and 62: MANAGING GLOBAL RISKRISK MANAGEMENT
- Page 63 and 64: CREDIT RISKCredit risk is the poten
- Page 65 and 66: [This page intentionally left blank
- Page 67 and 68: (1) 2010 primarily includes an addi
- Page 69 and 70: Non-Accrual Loans and AssetsThe tab
- Page 71 and 72: Renegotiated LoansThe following tab
- Page 73 and 74: Citi’s first mortgage portfolio i
- Page 75 and 76: Consumer Mortgage FICO and LTVData
- Page 77 and 78: Second Mortgages: December 31, 2010
- Page 79 and 80: Interest Rate Risk Associated with
- Page 81 and 82: North America Cards—FICO Informat
- Page 83 and 84: CONSUMER LOAN DETAILSConsumer Loan
- Page 85 and 86: Consumer Loan Modification Programs
- Page 87 and 88:
North America CardsNorth America ca
- Page 89 and 90:
Payment deferrals that do not conti
- Page 91 and 92:
Repurchase ReserveCiti has recorded
- Page 93 and 94:
Securities and Banking-Sponsored Pr
- Page 95 and 96:
The following table presents the co
- Page 97 and 98:
MARKET RISKMarket risk encompasses
- Page 99 and 100:
Trading PortfoliosPrice risk in tra
- Page 101 and 102:
INTEREST REVENUE/EXPENSE AND YIELDS
- Page 103 and 104:
AVERAGE BALANCES AND INTEREST RATES
- Page 105 and 106:
ANALYSIS OF CHANGES IN INTEREST EXP
- Page 107 and 108:
[This page intentionally left blank
- Page 109 and 110:
As required by SEC rules, the table
- Page 111 and 112:
The credit valuation adjustment amo
- Page 113 and 114:
The fair values shown are prior to
- Page 115 and 116:
Key Controls over Fair Value Measur
- Page 117 and 118:
The following table reflects the in
- Page 119 and 120:
The results of the July 1, 2010 tes
- Page 121 and 122:
As a result of the losses incurred
- Page 123 and 124:
MANAGEMENT’S ANNUAL REPORT ON INT
- Page 125 and 126:
• an “ownership change” under
- Page 127 and 128:
REPORT OF INDEPENDENT REGISTERED PU
- Page 129 and 130:
FINANCIAL STATEMENTS AND NOTES TABL
- Page 131 and 132:
CONSOLIDATED FINANCIAL STATEMENTSCO
- Page 133 and 134:
CONSOLIDATED BALANCE SHEET(Continue
- Page 135 and 136:
CONSOLIDATED STATEMENT OF CHANGES I
- Page 137 and 138:
CITIBANK CONSOLIDATED BALANCE SHEET
- Page 139 and 140:
NOTES TO CONSOLIDATED FINANCIAL STA
- Page 141 and 142:
Repurchase and Resale AgreementsSec
- Page 143 and 144:
ecoveries are added. Securities rec
- Page 145 and 146:
Consumer Mortgage Representations a
- Page 147 and 148:
Transfers of Financial AssetsFor a
- Page 149 and 150:
ACCOUNTING CHANGESChange in Account
- Page 151 and 152:
The following table reflects the in
- Page 153 and 154:
Measuring Liabilities at Fair Value
- Page 155 and 156:
Revisions to the Earnings-per-Share
- Page 157 and 158:
FUTURE APPLICATION OF ACCOUNTING ST
- Page 159 and 160:
3. DISCONTINUED OPERATIONSSale of T
- Page 161 and 162:
CitiCapitalOn July 31, 2008, Citigr
- Page 163 and 164:
5. INTEREST REVENUE AND EXPENSEFor
- Page 165 and 166:
Stock Award ProgramsCitigroup issue
- Page 167 and 168:
In January 2009, members of the Man
- Page 169 and 170:
Information with respect to stock o
- Page 171 and 172:
9. RETIREMENT BENEFITSThe Company h
- Page 173 and 174:
The following table shows the chang
- Page 175 and 176:
A one-percentage-point change in th
- Page 177 and 178:
Level 3 Roll ForwardThe reconciliat
- Page 179 and 180:
10. INCOME TAXESIn millions of doll
- Page 181 and 182:
The Company is currently under audi
- Page 183 and 184:
11. EARNINGS PER SHAREThe following
- Page 185 and 186:
13. BROKERAGE RECEIVABLES AND BROKE
- Page 187 and 188:
The table below shows the fair valu
- Page 189 and 190:
Debt Securities Held-to-MaturityThe
- Page 191 and 192:
Evaluating Investments for Other-Th
- Page 193 and 194:
The following is a 12-month roll-fo
- Page 195 and 196:
16. LOANSCitigroup loans are report
- Page 197 and 198:
Residential Mortgage Loan to Values
- Page 199 and 200:
The following table presents Corpor
- Page 201 and 202:
Included in the Corporate and Consu
- Page 203 and 204:
18. GOODWILL AND INTANGIBLE ASSETSG
- Page 205 and 206:
Intangible AssetsThe components of
- Page 207 and 208:
CGMHI has committed long-term finan
- Page 209 and 210:
20. Regulatory CapitalCitigroup is
- Page 211 and 212:
22. SECURITIZATIONS AND VARIABLE IN
- Page 213 and 214:
In millions of dollars As of Decemb
- Page 215 and 216:
Funding Commitments for Significant
- Page 217 and 218:
Credit Card SecuritizationsThe Comp
- Page 219 and 220:
Managed Loans—Citi HoldingsThe fo
- Page 221 and 222:
Key assumptions used in measuring t
- Page 223 and 224:
Mortgage Servicing RightsIn connect
- Page 225 and 226:
The Company administers one conduit
- Page 227 and 228:
Key Assumptions and Retained Intere
- Page 229 and 230:
Municipal InvestmentsMunicipal inve
- Page 231 and 232:
Derivative NotionalsIn millions of
- Page 233 and 234:
activities together with gains and
- Page 235 and 236:
Cash Flow HedgesHedging of benchmar
- Page 237 and 238:
The range of credit derivatives sol
- Page 239 and 240:
24. CONCENTRATIONS OF CREDIT RISKCo
- Page 241 and 242:
Trading account assets and liabilit
- Page 243 and 244:
The internal valuation techniques u
- Page 245 and 246:
In millions of dollars at December
- Page 247 and 248:
Changes in Level 3 Fair Value Categ
- Page 249 and 250:
In millions of dollarsDecember 31,2
- Page 251 and 252:
26. FAIR VALUE ELECTIONSThe Company
- Page 253 and 254:
The following table provides inform
- Page 255 and 256:
Certain structured liabilitiesThe C
- Page 257 and 258:
28. PLEDGED SECURITIES, COLLATERAL,
- Page 259 and 260:
The repurchase reserve estimation p
- Page 261 and 262:
CollateralCash collateral available
- Page 263 and 264:
29. CONTINGENCIESOverviewIn additio
- Page 265 and 266:
pursuant to which Citigroup agreed
- Page 267 and 268:
court filings under docket number 0
- Page 269 and 270:
30. CITIBANK, N.A. STOCKHOLDER’S
- Page 271 and 272:
Condensed Consolidating Statements
- Page 273 and 274:
Condensed Consolidating Statements
- Page 275 and 276:
Condensed Consolidating Balance She
- Page 277 and 278:
Condensed Consolidating Statements
- Page 279 and 280:
33. SELECTED QUARTERLY FINANCIAL DA
- Page 281 and 282:
SUPERVISION AND REGULATIONCitigroup
- Page 283 and 284:
Citigroup continues to evaluate its
- Page 285 and 286:
CORPORATE INFORMATIONCITIGROUP EXEC
- Page 287 and 288:
SignaturesPursuant to the requireme