

Citigroup Inc.
Citigroup Inc.
Citigroup Inc.

You also want an ePaper? Increase the reach of your titles
YUMPU automatically turns print PDFs into web optimized ePapers that Google loves.
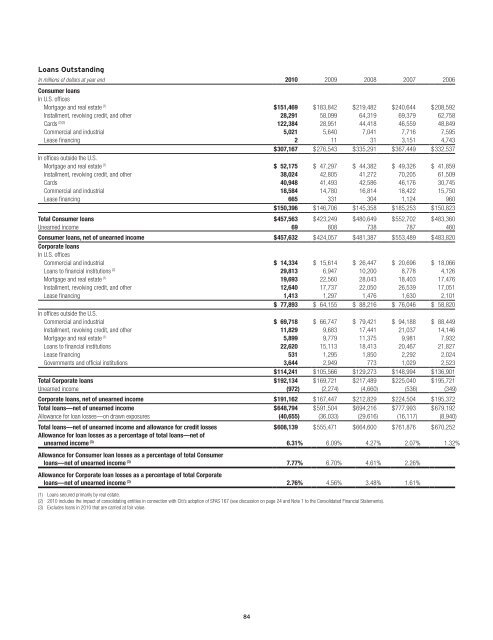
Loans OutstandingIn millions of dollars at year end 2010 2009 2008 2007 2006Consumer loansIn U.S. officesMortgage and real estate (1) $151,469 $183,842 $219,482 $240,644 $208,592Installment, revolving credit, and other 28,291 58,099 64,319 69,379 62,758Cards (2)(3) 122,384 28,951 44,418 46,559 48,849Commercial and industrial 5,021 5,640 7,041 7,716 7,595Lease financing 2 11 31 3,151 4,743$307,167 $276,543 $335,291 $367,449 $332,537In offices outside the U.S.Mortgage and real estate (1) $ 52,175 $ 47,297 $ 44,382 $ 49,326 $ 41,859Installment, revolving credit, and other 38,024 42,805 41,272 70,205 61,509Cards 40,948 41,493 42,586 46,176 30,745Commercial and industrial 18,584 14,780 16,814 18,422 15,750Lease financing 665 331 304 1,124 960$150,396 $146,706 $145,358 $185,253 $150,823Total Consumer loans $457,563 $423,249 $480,649 $552,702 $483,360Unearned income 69 808 738 787 460Consumer loans, net of unearned income $457,632 $424,057 $481,387 $553,489 $483,820Corporate loansIn U.S. officesCommercial and industrial $ 14,334 $ 15,614 $ 26,447 $ 20,696 $ 18,066Loans to financial institutions (2) 29,813 6,947 10,200 8,778 4,126Mortgage and real estate (1) 19,693 22,560 28,043 18,403 17,476Installment, revolving credit, and other 12,640 17,737 22,050 26,539 17,051Lease financing 1,413 1,297 1,476 1,630 2,101$ 77,893 $ 64,155 $ 88,216 $ 76,046 $ 58,820In offices outside the U.S.Commercial and industrial $ 69,718 $ 66,747 $ 79,421 $ 94,188 $ 88,449Installment, revolving credit, and other 11,829 9,683 17,441 21,037 14,146Mortgage and real estate (1) 5,899 9,779 11,375 9,981 7,932Loans to financial institutions 22,620 15,113 18,413 20,467 21,827Lease financing 531 1,295 1,850 2,292 2,024Governments and official institutions 3,644 2,949 773 1,029 2,523$114,241 $105,566 $129,273 $148,994 $136,901Total Corporate loans $192,134 $169,721 $217,489 $225,040 $195,721Unearned income (972) (2,274) (4,660) (536) (349)Corporate loans, net of unearned income $191,162 $167,447 $212,829 $224,504 $195,372Total loans—net of unearned income $648,794 $591,504 $694,216 $777,993 $679,192Allowance for loan losses—on drawn exposures (40,655) (36,033) (29,616) (16,117) (8,940)Total loans—net of unearned income and allowance for credit losses $608,139 $555,471 $664,600 $761,876 $670,252Allowance for loan losses as a percentage of total loans—net ofunearned income (3) 6.31% 6.09% 4.27% 2.07% 1.32%Allowance for Consumer loan losses as a percentage of total Consumerloans—net of unearned income (3) 7.77% 6.70% 4.61% 2.26%Allowance for Corporate loan losses as a percentage of total Corporateloans—net of unearned income (3) 2.76% 4.56% 3.48% 1.61%(1) Loans secured primarily by real estate.(2) 2010 includes the impact of consolidating entities in connection with Citi’s adoption of SFAS 167 (see discussion on page 24 and Note 1 to the Consolidated Financial Statements).(3) Excludes loans in 2010 that are carried at fair value.84


