- Page 2:
COMPREHENSIVE CHEMICAL KINETICS
- Page 5 and 6:
P.O.ELSEVIER PUBLISHING COMPANY335
- Page 7 and 8:
Contributors to Volume 1L. BATTDepa
- Page 9 and 10:
This Page Intentionally Left Blank
- Page 11 and 12:
XCONTENTS4.3 Gas chromatography ...
- Page 13:
XI1CONTENTS4.6 Magnetic measurement
- Page 19:
4 EXPERIMENTAL METHODS FOR SLOW REA
- Page 23 and 24:
8EXPERIMENTAL METHODS FOR SLOW REAC
- Page 25 and 26:
Reaction Furnace CircuitI10 EXPERIM
- Page 27 and 28:
12 EXPERIMENTAL METHODS FOR SLOW RE
- Page 29 and 30:
14 EXPERIMENTAL METHODS FOR SLOW RE
- Page 31 and 32:
16 EXPERIMENTAL METHODS FOR SLOW RE
- Page 33 and 34:
18 EXPERIMENTAL METHODS FOR SLOW RE
- Page 35 and 36:
20 EXPERIMENTAL METHODS FOR SLOW RE
- Page 37 and 38:
22 EXPERIMENTAL METHOD§ FOR SLOW R
- Page 39 and 40:
24 EXPERIMENTAL METHODS FOR SLOW RE
- Page 41 and 42:
26 EXPERIMENTAL METHODS FOR SLOW RE
- Page 43 and 44:
28 EXPERIMENTAL METHODS FOR SLOW RE
- Page 45 and 46:
30 EXPERIMENTAL METHODS FOR SLOW RE
- Page 47 and 48:
32 EXPERIMENTAL METHODS FOR SLOW RE
- Page 49 and 50:
34 EXPERIMENTAL METHODS FOR SLOW RE
- Page 51 and 52:
~~ ~36 EXPERIMENTAL METHODS FOR SLO
- Page 53 and 54:
38 EXPERIMENTAL METHODS FOR SLOW RE
- Page 55 and 56:
~~~ ~ i_~~~~ ._I _.-.~ -~-~~L~ -~TA
- Page 57 and 58:
42 EXPERIMENTAL METHODS FOR SLOW RE
- Page 59 and 60:
44 EXPERIMENTAL METHODS FOR SLOW RE
- Page 61 and 62:
46 EXPERIMENTAL METHODS FOR SLOW RE
- Page 63 and 64:
48 EXPERIMENTAL METHODS FOR SLOW RE
- Page 65 and 66:
50 EXPERIMENTAL METHODS FOR SLOW RE
- Page 67 and 68:
52 EXPERIMENTAL METHODS FOR SLOW RE
- Page 69 and 70:
54 EXPERIMENTAL METHODS FOR SLOW RE
- Page 71 and 72:
56 EXPERIMENTAL METHODS FOR SLOW RE
- Page 73 and 74:
58 EXPERIMENTAL METHODS FOR SLOW RE
- Page 75 and 76:
60 EXPERIMENTAL METHODS FOR SLOW RE
- Page 77 and 78:
62 EXPERIMENTAL METHODS FOR SLOW RE
- Page 79 and 80:
64 EXPERIMENTAL METHODS FOR SLOW RE
- Page 81 and 82:
66 EXPERIMENTAL METHODS FOR SLOW RE
- Page 83 and 84:
68 EXPERIMENTAL METHODS FOR SLOW RE
- Page 85 and 86:
70 EXPERIMENTAL METHODS FOR SLOW RE
- Page 87 and 88:
72 EXPERIMENTAL METHODS FOR SLOW RE
- Page 89 and 90:
74 EXPERIMENTAL METHODS FOR SLOW RE
- Page 91 and 92:
76 EXPERIMENTAL METHODS FOR SLOW RE
- Page 93 and 94:
78 EXPERIMENTAL METHODS FOR SLOW RE
- Page 95 and 96:
80 EXPERIMENTAL METHODS FOR SLOW RE
- Page 97 and 98:
82 EXPERIMENTAL METHODS FOR SLOW RE
- Page 99 and 100:
84 EXPERIMENTAL METHODS FOR SLOW RE
- Page 101 and 102:
86 EXPERIMENTAL METHODS FOR SLOW RE
- Page 103 and 104:
88 EXPERIMENTAL METHODS FOR SLOW RE
- Page 105 and 106:
90 EXPERIMENTAL METHODS FOR SLOW RE
- Page 107 and 108:
92 EXPERIMENTAL METHODS FOR SLOW RE
- Page 109 and 110:
94 EXPERIMENTAL METHODS FOR SLOW RE
- Page 111 and 112:
96 EXPERIMENTAL METHODS FOR SLOW RE
- Page 113 and 114:
98 EXPERIMENTAL METHODS FOR SLOW RE
- Page 115 and 116:
100 EXPERIMENTAL METHODS FOR SLOW R
- Page 117 and 118:
102 EXPERIMENTAL METHODS FOR SLOW R
- Page 119 and 120:
104 EXPERIMENTAL METHODS FOR SLOW R
- Page 121 and 122:
106 EXPERIMENTAL METHODS FOR SLOW R
- Page 123 and 124:
108 EXPERIMENTAL METHODS FOR SLOW R
- Page 125 and 126:
110 EXPERIMENTAL METHODS FOR SLOW R
- Page 127 and 128:
Chapter 2Experimental Methods for t
- Page 129 and 130:
114 EXPERIMENTAL METHODS FOR FAST R
- Page 131 and 132:
116 EXPERIMENTAL METHODS FOR FAST R
- Page 133 and 134:
118 EXPERIMENTAL METHODS FOR FAST R
- Page 135 and 136:
120 EXPERIMENTAL METHODS FOR FAST R
- Page 137 and 138:
122 EXPERIMENTAL METHODS FOR FAST R
- Page 139 and 140:
;,124 EXPERIMENTAL METHODS FOR FAST
- Page 141 and 142:
126 EXPERIMENTAL METHODS FOR FAST R
- Page 143 and 144:
128 EXPERIMENTAL METHODS FOR FAST R
- Page 145 and 146:
130 EXPERIMENTAL METHODS FOR FAST R
- Page 147 and 148:
132 EXPERIMENTAL METHODS FOR FAST R
- Page 149 and 150:
134 EXPERIMENTAL METHODS FOR FAST R
- Page 151 and 152:
136 EXPERIMENTAL METHODS FOR FAST R
- Page 153 and 154:
138 EXPERIMENTAL METHODS FOR FAST R
- Page 155 and 156:
140 EXPERIMENTAL METHODS FOR FAST R
- Page 157 and 158:
142 EXPERIMENTAL METHODS FOR FAST R
- Page 159 and 160:
144 EXPERIMENTAL METHODS FOR FAST R
- Page 161 and 162:
146 EXPERIMENTAL METHODS FOR FAST R
- Page 163 and 164:
148 EXPERIMENTAL METHODS FOR FAST R
- Page 165 and 166:
150 EXPERIMENTAL METHODS FOR FAST R
- Page 167 and 168:
152 EXPERIMENTAL METHODS FOR FAST R
- Page 169 and 170:
154 EXPERIMENTAL METHODS FOR FAST R
- Page 171 and 172:
156 EXPERIMENTAL METHODS FOR FAST R
- Page 173 and 174:
158 EXPERIMENTAL METHODS FOR FAST R
- Page 175 and 176:
160 EXPERIMENTAL METHODS FOR FAST R
- Page 177 and 178:
162 EXPERIMENTAL METHODS FOR FAST R
- Page 179 and 180:
164 EXPERIMENTAL METHODS FOR FAST R
- Page 181 and 182:
166 EXPERIMENTAL METHODS FOR FAST R
- Page 183 and 184:
168 EXPERIMENTAL METHODS FOR FAST R
- Page 185 and 186:
170 EXPERIMENTAL METHODS FOR FAST R
- Page 187 and 188:
172 EXPERIMENTAL METHODS FOR FAST R
- Page 189 and 190:
174 EXPERIMENTAL METHODS FOR FAST R
- Page 191 and 192:
176 EXPERIMENTAL METHODS FOR FAST R
- Page 193 and 194:
178 REFERENCES46 M. EIGEN AND L. DE
- Page 195 and 196:
Chapter 3Experimental Methods for t
- Page 197 and 198:
182 EXPERIMENTAL METHODS FOR HETERO
- Page 199 and 200:
184 EXPERIMENTAL METHODS FOR HETERO
- Page 201 and 202:
186 EXPERIMENTAL METHODS FOR HETERO
- Page 203 and 204:
188 EXPERIMENTAL METHODS FOR HETERO
- Page 205 and 206:
~~~ ._190 EXPERIMENTAL METHODS FOR
- Page 207 and 208:
192 EXPERIMENT A L MET H 0 D S F 0
- Page 209 and 210:
194 EXPERIMENT A L MET H o D s F o
- Page 211 and 212:
196 EXPERIMENTAL METHODS FOR HETERO
- Page 213 and 214:
198 EXPERIMENTAL METHODS FOR HETERO
- Page 215 and 216:
200 EXPERIMENTAL METHODS FOR HETERO
- Page 217 and 218:
202 EXPERIMENT A L MET H 0 D S F 0
- Page 219 and 220:
204 EXPERIMENTAL METHODS FOR HETERO
- Page 221 and 222:
206 EXPERXMENTAL METHODS FOR HETERO
- Page 223 and 224: 208 EXPERIMENTAL METHODS FOR HETERO
- Page 225 and 226: 210 EXPERIMENTAL METHODS FOR HETERO
- Page 227 and 228: 212 EXPERIMENTAL METHODS FOR HETERO
- Page 229 and 230: 214 EXPERIMENTAL METHODS FOR HETERO
- Page 231 and 232: 216 EXPERIMENTAL METHODS FOR HETERO
- Page 233 and 234: 218 EXPERIMENTAL METHODS FOR HETERO
- Page 235 and 236: 220 EXPERIMENTAL METHODS FOR HETERO
- Page 237 and 238: 222 EXPERIMENT A L METHODS F 0 R HE
- Page 239 and 240: 224 EXPERIMENTAL METHODS FOR HETERO
- Page 241 and 242: 226 EXPERIMENT A L MET H 0 D S F 0
- Page 243 and 244: 228 EXPERIMENT A L MET H 0 D S F 0
- Page 245 and 246: 230 EXPERIMENT A L METHOD s FOR HET
- Page 247 and 248: 232 EXPERIMENTAL METHODS FOR HETERO
- Page 249 and 250: 234 EXPERIMENTAL METHODS FOR HETERO
- Page 251 and 252: 236 EXPERIMENT A L METHOD s FOR HE
- Page 253 and 254: 238 EXPERIMENTAL METHODS FOR HETERO
- Page 255 and 256: 240 EXPERIMENT A L MET H 0 D S F 0
- Page 257 and 258: 242 EXPERIMENT A L ME TH 0 D S FOR
- Page 259 and 260: 244 EXPERIMENTAL METHODS FOR HETERO
- Page 261 and 262: 246 EXPERIMENTAL METHODS FOR HETERO
- Page 263 and 264: 248 EXPERIMENT A L METHOD s F o R H
- Page 265 and 266: 250 EXPERIMENTAL METHODS FOR HETERO
- Page 267 and 268: 252 EXPERIMENTAL METHODS FOR HETERO
- Page 269 and 270: 254 EXPERIMENTAL MET HODS FOR HETER
- Page 271 and 272: 256 EXPERIMENTAL METHODS FOR HETERO
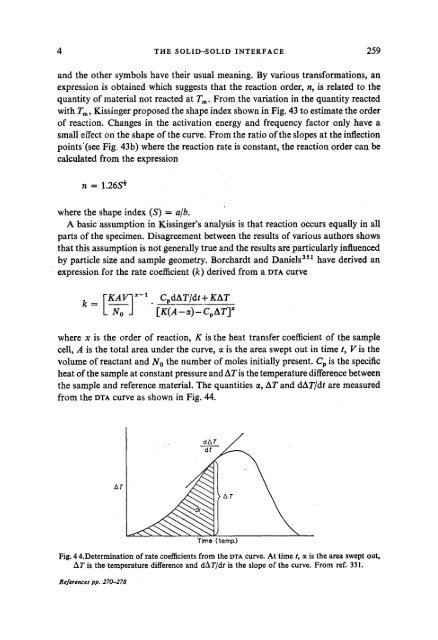
- Page 273: 258 EXPERIMENT A L METHODS F 0 R HE
- Page 277 and 278: 262 EXPERIMENTAL METHODS FOR HETERO
- Page 279 and 280: 264 EXPERIMENTAL METHODS FOR HETERO
- Page 281 and 282: 266 EXPERIMENT A L MET H o D s F o
- Page 283 and 284: 268 EXPERIMENTAL METHODS FOR HETERO
- Page 285 and 286: 270 EXPERIMENTAL MET HODS FOR HE TE
- Page 287 and 288: 272 EXPERIMENTAL METHODS FOR HETERO
- Page 289 and 290: 274 EXPERIMENT A L METHOD s FOR HE
- Page 291 and 292: 276 EXPERIMENTAL METHODS FOR HETERO
- Page 293 and 294: 278 EXPERIMENTAL METHODS FOR HETERO
- Page 295 and 296: 280 DETECTION AND ESTIMATION OF INT
- Page 297 and 298: 282 DETECTION AND ESTIMATION OF INT
- Page 299 and 300: 284 DETECTION AND ESTIMATION OF INT
- Page 301 and 302: 286 DETECTION AND ESTIMATION OF INT
- Page 303 and 304: 288 DETECTION AND ESTIMATION OF INT
- Page 305 and 306: 290 DETECTION AND ESTIMATION OF INT
- Page 307 and 308: 292 DETECTION AND ESTIMATION OF INT
- Page 309 and 310: 294 DETECTION AND ESTIMATION OF INT
- Page 311 and 312: 296 DETECTION AND ESTIMATION OF INT
- Page 313 and 314: 298 DETECTION AND ESTIMATION OF INT
- Page 315 and 316: 300 DETECTION AND ESTIMATION OF INT
- Page 317 and 318: 302 DETECTION AND ESTIMATION OF INT
- Page 319 and 320: 304 DETECTION AND ESTIMATION OF INT
- Page 321 and 322: 306 DETECTION AND ESTIMATION OF INT
- Page 323 and 324: 308 DETECTION AND ESTIMATION OF INT
- Page 325 and 326:
310 DETECTION AND ESTIMATION OF INT
- Page 327 and 328:
312 DETECTION AND ESTIMATION OF INT
- Page 329 and 330:
314 DETECTION AND ESTIMATION OF INT
- Page 331 and 332:
316 DETECTION AND ESTIMATION OF INT
- Page 333 and 334:
318 DETECTION AND ESTIMATION OF INT
- Page 335 and 336:
320 DETECTION AND ESTIMATION OF INT
- Page 337 and 338:
322 DETECTION AND ESTIMATION OF INT
- Page 339 and 340:
324 DETECTION AND ESTIMATION OF INT
- Page 341 and 342:
326 DETECTION AND ESTIMATION OF INT
- Page 343 and 344:
328 DETECTION AND ESTIMATION OF INT
- Page 345 and 346:
330 DETECTION AND ESTIMATION OF INT
- Page 347 and 348:
332 DETECTION AND ESTIMATION OF INT
- Page 349 and 350:
334 DETECTION AND ESTIMATION OF INT
- Page 351 and 352:
336 DETECTION AND ESTIMATION OF INT
- Page 353 and 354:
338 DETECTION AND ESTIMATION OF INT
- Page 355 and 356:
340 DETECTION AND ESTIMATION OF INT
- Page 357 and 358:
342 DETECTION AND ESTIMATION OF INT
- Page 359 and 360:
344 TREATMENT OF EXPERIMENTAL DATAf
- Page 361 and 362:
346 TREATMENT OF EXPERIMENTAL DATAp
- Page 363 and 364:
348 TREATMENT OF EXPERIMENTAL DATAg
- Page 365 and 366:
350 TREATMENT OF EXPERIMENTAL DATAT
- Page 367 and 368:
352 TREATMENT OF EXPERIMENTAL DATAW
- Page 369 and 370:
354 TREATMENT OF EXPERIMENTAL DATA[
- Page 371 and 372:
356 TREATMENT OF EXPERIMENTAL DATAT
- Page 373 and 374:
358 TREATMENT OF EXPERIMENTAL DATA(
- Page 375 and 376:
360 TREATMENT OF EXPERIMENTAL DATA(
- Page 377 and 378:
362 TREATMENT OF EXPERIMENTAL DATAI
- Page 379 and 380:
364 TREATMENT OF EXPERIMENTAL DATAv
- Page 381 and 382:
366 TREATMENT OF EXPERIMENTAL DATAW
- Page 383 and 384:
368 TREATMENT OF EXPERIMENTAL DATAT
- Page 385 and 386:
370 TREATMENT OF EXPERIMENTAL DATAc
- Page 387 and 388:
372 TREATMENT OF EXPERIMENTAL DATAw
- Page 389 and 390:
374 TREATMENT OF EXPERIMENTAL DATAT
- Page 391 and 392:
376 TREATMENT OF EXPERIMENTAL DATAF
- Page 393 and 394:
378 TREATMENT OF EXPERIMENTAL DATAc
- Page 395 and 396:
380 TREATMENT OF EXPERIMENTAL DATAe
- Page 397 and 398:
382 TREATMENT OF EXPERIMENTAL DATAa
- Page 399 and 400:
384 TREATMENT OF EXPERIMENTAL DATAt
- Page 401 and 402:
386 TREATMENT OF EXPERIMENTAL DATAT
- Page 403 and 404:
388 TREATMENT OF EXPERIMENTAL DATAs
- Page 405 and 406:
390 TREATMENT OF EXPERIMENTAL DATAI
- Page 407 and 408:
392 TREATMENT OF EXPERIMENTAL DATAt
- Page 409 and 410:
394 TREATMENT OF EXPERIMENTAL DATAt
- Page 411 and 412:
396 TREATMENT OF EXPERIMENTAL DATAc
- Page 413 and 414:
398 TREATMENT OF EXPERIMENTAL DATA(
- Page 415 and 416:
400 TREATMENT OF EXPERIMENTAL DATAF
- Page 417 and 418:
402 TREATMENT OF EXPERIMENTAL DATAt
- Page 419 and 420:
404 TREATMENT OF EXPERIMENTAL DATA4
- Page 421 and 422:
406 TREATMENT OF EXPERIMENTAL DATAe
- Page 423 and 424:
408 TREATMENT OF EXPERIMENTAL DATAA
- Page 425 and 426:
410 TREATMENT OF EXPERIMENTAL DATAs
- Page 427 and 428:
41 2 TREATMENT OF EXPERIMENTAL DATA
- Page 429 and 430:
~~414 TREATMENT OF EXPERIMENTAL DAT
- Page 431 and 432:
416 TREATMENT OF EXPERIMENTAL DATAT
- Page 433 and 434:
41 8 TREATMENT OF EXPERIMENTAL DATA
- Page 435 and 436:
420 TREATMENT OF EXPERIMENTAL DATAA
- Page 437 and 438:
IndexAabsorption cross section, che
- Page 439 and 440:
424 INDEXbenzyl chloride, matrix ph
- Page 441 and 442:
426 INDEXchlorine (contdj—, react
- Page 443 and 444:
428 INDEXdeuterium oxide, addition
- Page 445 and 446:
430 INDEXentropy change, in radical
- Page 447 and 448:
432 INDEXfrequency of oscillation,
- Page 449 and 450:
434 INDEXhydrogen atoms (contdj—,
- Page 451 and 452:
436 INDEXisotopes (contd.J—, use
- Page 453 and 454:
438 INDEXmethyl radicals, chain ter
- Page 455 and 456:
440 INDEXoctadiene, ESR determinati
- Page 457 and 458:
442 INDEXphotoelectric measurement,
- Page 459 and 460:
444 INDEXrad, definition of, 66radi
- Page 461 and 462:
446 INDEXSchmidt number, and mass t
- Page 463 and 464:
448 INDEXTtailing reducer, in gas c
- Page 465:
450 INDEXviscosity, and diffusion c