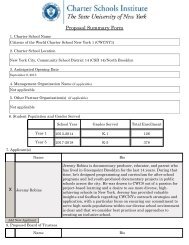
Organizational Chart FLACS I, II, III First Year - Newyorkcharters.org
Organizational Chart FLACS I, II, III First Year - Newyorkcharters.org
Organizational Chart FLACS I, II, III First Year - Newyorkcharters.org
- No tags were found...

Create successful ePaper yourself
Turn your PDF publications into a flip-book with our unique Google optimized e-Paper software.
Family Life Academy <strong>Chart</strong>er School 3PROJECTED BUDGET / OPERATING PLAN FOR YEAR ONEJuly 1, 2014 to June 30, 2015DESCRIPTION OF ASSUMPTIONSTotal Revenue 1,859,700 62,340 6,000 - 75,000 2,003,040Total Expenses 1,089,650 60,000 58,800 - 789,000 1,997,450Net Income 770,050 2,340 (52,800) - (714,000) 5,590Actual Student Enrollment 100 - 100Total Paid Student Enrollment 100 - 100PROGRAM SERVICESSUPPORT SERVICESREGULAREDUCATIONSPECIALEDUCATION OTHER FUNDRAISINGMANAGEMENT &GENERALTOTALREVENUEREVENUES FROM STATE SOURCESPer Pupil RevenueCY Per Pupil RateSchool District 1 (Enter Name) - - - - - -School District 2 (Enter Name) - - - - - - -School District 3 (Enter Name) - - - - - - -School District 4 (Enter Name) - - - - - - -School District 5 (Enter Name) - - - - - - -School District 6 (Enter Name) - - - - - - -School District 7 (Enter Name) 13,527 - - - - -School District 8 (Enter Name) 13,527 1,352,700 - - - - 1,352,700 Anticipate enrolling 100 students with an allocation of $13,527 per student.School District 9 (Enter Name) 13,527 - - - - -School District 10 (Enter Name) - - - - - - -School District 11 (Enter Name) - - - - - - -School District 12 (Enter Name) - - - - - - -School District 13 (Enter Name) - - - - - - -School District 14 (Enter Name) - - - - - - -School District 15 (Enter Name) - - - - - - -School District - ALL OTHER - - - - - - -TOTAL Per Pupil Revenue (Average Districts Per Pupil Funding) - 1,352,700 - - - - 1,352,700Special Education Revenue - 62,340 - - - 62,340GrantsStimulus - - - - - -DYCD (Department of Youth and Community Developmt.) 90,000 - - - - 90,000 approxOther - - - - - -Other - - - - - -TOTAL REVENUE FROM STATE SOURCES 1,442,700 62,340 - - - 1,505,040REVENUE FROM FEDERAL FUNDINGIDEA Special Needs - - - - - -Title I 65,000 0 0 - - 65,000 85 students at 700 eachProjections based on 4 students receving 20-59% services at $10,390 and 0 studentsreceiving over 60% services at $19,049.Title Funding - Other 0 0 6,000 - - 6,000 30 ELL students at 155 per plus title 2 at .84 of 100 * 60 or appr 5000School Food Service (Free Lunch) 75,000 0 0 - - 75,000 85 % free and reduced and # of meals per dayGrants<strong>Chart</strong>er School Program (CSP) Planning & Implementation 250,000 - - - - 250,000 obtain CSP and use 300000 for year 1Other - - - - - -Other - - - - - -TOTAL REVENUE FROM FEDERAL SOURCES 390,000 - 6,000 - - 396,000LOCAL and OTHER REVENUEContributions and Donations 0 0 0 0 0 - private and govt grantsFundraising 2,000 0 0 0 0 2,000 school wide events pta bd raising and board givingErate Reimbursement 0 0 0 0 75,000 75,000 based on 90% reimb of certain coats so .80 of tech costs as some are not reimbEarnings on Investments 0 0 0 0 0 -Interest Income 0 0 0 0 0 - bank interestFood Service (Income from meals) 0 0 0 0 0 -Text Book 25,000 0 0 0 0 25,000 Budget based on a rate of $14.98 per student Plus Projections based on aOTHER 0 0 0 0 0 -TOTAL REVENUE FROM LOCAL and OTHER SOURCES 27,000 - - - 75,000 102,000TOTAL REVENUE 1,859,700 62,340 6,000 - 75,000 2,003,040