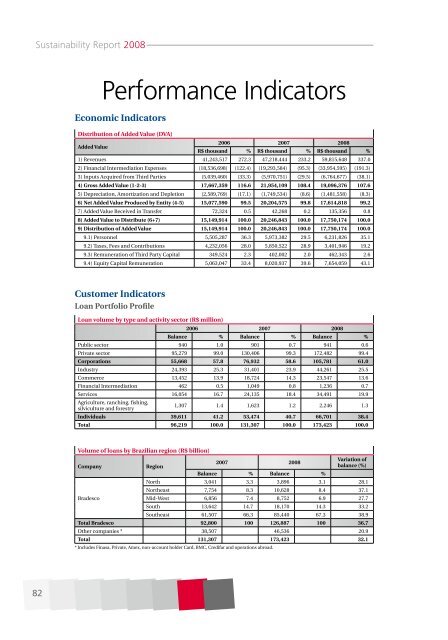
Sustainability Report 2008Performance IndicatorsEconomic IndicatorsDistribution of Added Value (DVA)Added Value2006 2007 2008R$ thousand % R$ thousand % R$ thousand %1) Revenues 41,243,517 272.3 47,218,444 233.2 59,815,648 337.02) Financial Intermediation Expenses (18,536,698) (122.4) (19,293,584) (95.3) (33,954,595) (191.3)3) Inputs Acquired from Third Parties (5,039,460) (33.3) (5,970,751) (29.5) (6,764,677) (38.1)4) Gross Added Value (1-2-3) 17,667,359 116.6 21,954,109 108.4 19,096,376 107.65) Depreciation, Amortization and Depletion (2,589,769) (17.1) (1,749,534) (8.6) (1,481,558) (8.3)6) Net Added Value Produced by Entity (4-5) 15,077,590 99.5 20,204,575 99.8 17,614,818 99.27) Added Value Received in Transfer 72,324 0.5 42,268 0.2 135,356 0.88) Added Value to Distribute (6+7) 15,149,914 100.0 20,246,843 100.0 17,750,174 100.09) Distribution of Added Value 15,149,914 100.0 20,246,843 100.0 17,750,174 100.09.1) Personnel 5,505,287 36.3 5,973,382 29.5 6,231,826 35.19.2) Taxes, Fees and Contributions 4,232,056 28.0 5,850,522 28.9 3,401,946 19.29.3) Remuneration of Third Party Capital 349,524 2.3 402,002 2.0 462,343 2.69.4) Equity Capital Remuneration 5,063,047 33.4 8,020,937 39.6 7,654,059 43.1Customer IndicatorsLoan Portfolio ProfileLoan volume by type and activity sector (R$ million)2006 2007 2008Balance % Balance % Balance %Public sector 940 1.0 901 0.7 941 0.6Private sector 95,279 99.0 130,406 99.3 172,482 99.4Corporations 55,668 57.8 76,932 58.6 105,781 61.0Industry 24,393 25.3 31,401 23.9 44,261 25.5Commerce 13,452 13.9 18,724 14.3 23,547 13.6Financial Intermediation 462 0.5 1,049 0.8 1,236 0.7Services 16,054 16.7 24,135 18.4 34,491 19.9Agriculture, ranching, fishing,silviculture and forestry1,307 1.4 1,623 1.2 2,246 1.3Individuals 39,611 41.2 53,474 40.7 66,701 38.4Total 96,219 100.0 131,307 100.0 173,423 100.0Volume of loans by Brazilian region (R$ billion)Variation of2007 2008CompanyRegionbalance (%)Balance % Balance %North 3,041 3.3 3,896 3.1 28.1Northeast 7,754 8.3 10,628 8.4 37.1BradescoMid-West 6,856 7.4 8,752 6.9 27.7South 13,642 14.7 18,170 14.3 33.2Southeast 61,507 66.3 85,440 67.3 38.9Total Bradesco 92,800 100 126,887 100 36.7Other <strong>com</strong>panies * 38,507 46,536 20.9Total 131,307 173,423 32.1* Includes Finasa, Private, Amex, non-account holder Card, BMC, Credifar and operations abroad.82
Comments and ComplaintsChannels used – BankChannel Number %Bacen 7,319 26Procon 15,983 57Media 503 2Letter 1,553 5Ombudsman – 2 nd level 2,820 10Total 28,178 100Comments and Complaints – Bank(Complaints, Suggestions and Compliments made atAlô Bradesco – SAC and Internet – option Contact Us)Channel Amount %Calls 106,911 63E-mails 62,425 37Total 169,336 100Channels used – Bradesco Seguros e PrevidênciaChannels Amount %0 800 12,462 67.10Contact Ombudsman 3,117 16.78Susep 695 3.74Contact Us 577 3.11ANS* 497 2.68Alô Bradesco 467 2.51Procon 310 1.67Ombudsman 291 1.57Press Agency 105 0.57Bacen 35 0.19Letter 15 0.08Total 18,571 100.00* Requests of National Agency for Supplementary Healthcare(ANS) are answered by the Service and Operational ExecutiveOversight Board – Bradesco Saúde S.A.; therefore, thisfigure is not included in the total requests answered bythe Ombudsman of Bradesco Seguros e Previdência.Employee IndicatorsNumber of employees by <strong>com</strong>pany2006 2007 2008Banco Bradesco 63,163 65,050 69,411Subsidiaries 12,702 17,054 17,211Amex 1 2,566 - -BEC 2 875 - -BMC 3 - 669 -Total 79,306 82,773 86,6221 Employees not counted in 2007, sincethey were staff at subsidiaries.2 Employees not counted in 2007, since theywere staff at Banco Bradesco.3 Employees not counted in 2008, sincethey were staff at subsidiaries.Employees by category2006 2007 2008Executive Officers 106 105 119Managers 6,168 7,678 8,302Supervision/Technicians 27,582 28,962 32,167Administrative 14,688 18,125 17,879Operational 30,767 27,903 28,155Total jobs by work day – %2006 2007 2008Full time 63.2 64.4 65.2Part time 36.8 35.6 34.8Breakdown of promotions and transfers2006 2007 2008Promotions 14,228 11,477 19,418Promotions withtransfers2,222 7,484 7,118Transfers 5,822 4,484 5,448Employee profileIndicatorsConsolidatedAge Men Women TotalUp to 17 years 251 454 70518 to 30 years 22,443 22,276 44,71931 to 40 years 10,302 11,330 21,63241 to 50 years 9,550 6,735 16,285Over 50 years 2,322 959 3,281Average age 32.6 31.1 31.9Length of serviceUp to 3 years 16,833 16,326 33,1594 to 10 years 10,427 10,877 21,30411 to 20 years 8,094 8,051 16,145Over 20 years 9,514 6,500 16,014Average length of service 10.0 9.3 9.6Educational backgroundPrimary school 412 220 632High school 7,051 5,955 13,006University 37,405 35,579 72,984Work dayPart time 14,036 16,092 30,128Full time 30,832 25,662 56,494Leadership (<strong>com</strong>missioned officers)Non-<strong>com</strong>missioned 20,122 21,914 42,036Commissioned 24,746 19,840 44,586Total 44,868 41,754 86,622Geographic distribution of employees2006 2007 2008North 2,277 2,497 2,800Northeast 9,577 10,306 10,760Mid-west 3,754 4,054 4,359Southeast 56,575 58,323 60,560South 7,026 7,489 8,032In Brazil 79,209 82,669 86,511Abroad 97 104 111Turnover rate2006 2007 2008Turnover * 8.84% 9.01% 10.75%* (Total terminations/average staff) x 100Average staff = opening staff + closing staff/2Breakdown of female staffWomen 2006 2007 2008Total staff 37,738 39,454 41,754New hires 4,276 4,978 6,073Promotions/transfers11,147 11,023 14,711
- Page 2 and 3:
Sustainability Report 2008Initiativ
- Page 4 and 5:
Sustainability Report 2008Message f
- Page 6 and 7:
Sustainability Report 2008Sustainab
- Page 8 and 9:
Sustainability Report 2008AWARENESS
- Page 10:
Sustainability Report 2008electroni
- Page 13 and 14:
Banking InclusionWe always practice
- Page 15 and 16:
international market for onlending
- Page 17 and 18:
Expresso, the service offers all of
- Page 20 and 21:
Sustainability Report 2008The Equat
- Page 22 and 23:
Sustainability Report 2008Social-en
- Page 24 and 25:
Sustainability Report 2008Microcred
- Page 26 and 27:
Sustainability Report 2008Amount on
- Page 28 and 29:
Sustainability Report 2008Certifica
- Page 30 and 31:
Sustainability Report 2008guarantee
- Page 32: Sustainability Report 2008Responsib
- Page 35 and 36: November 2008 as as a voluntary ini
- Page 37 and 38: In 2008, we started a process thats
- Page 39 and 40: CustomersOur basic guideline is to
- Page 41 and 42: meetings and presentations; theEcon
- Page 43 and 44: Most frequent complaintsThe most fr
- Page 45 and 46: Customer SecurityInformation about
- Page 47 and 48: Staff DistributionBrazil❖ Employe
- Page 49 and 50: Attracting and retaining talentThe
- Page 51 and 52: the banking system for employees wh
- Page 53 and 54: Training courses promote profession
- Page 55 and 56: inclusion, technological advances,
- Page 57 and 58: SuppliersFor the Organization, effe
- Page 59 and 60: participated in the 6 th Meeting, l
- Page 61 and 62: Besides the Bradesco Volunteer Prog
- Page 63 and 64: NGOsBradesco maintains constant dia
- Page 65 and 66: chain, inviting approximately 60com
- Page 67 and 68: Goals and Objectives of 2008Reduce
- Page 69 and 70: The main goal of Bradesco’s priva
- Page 71 and 72: Students served in 2008, by educati
- Page 73 and 74: Forming citizensCreated in 1956, th
- Page 75 and 76: Fundação AmazonasSustentável (FA
- Page 77 and 78: Fundação SOS Mata AtlânticaSince
- Page 79 and 80: SponsorshipsOwn fundsThrough incent
- Page 81: tabulated and assisted in the prepa
- Page 85 and 86: FleetVehiclesProprietary Leased2007
- Page 87 and 88: 5 - Employee indicators 2008 2007Nu
- Page 89 and 90: GRI DescriptionAnswerCommitments to
- Page 91 and 92: Statement of AssuranceBradesco h a
- Page 93 and 94: non-financial indicators establishe
- Page 95: Sustainability AcknowledgementsMain
- Page 98 and 99: Additional Contents 2008The Challen
- Page 100 and 101: Additional Contents 2008Parameters
- Page 102 and 103: Additional Contents 2008Insurance f
- Page 104 and 105: Additional Contents 2008Environment
- Page 106 and 107: Additional Contents 2008Special Pro
- Page 108 and 109: Additional Contents 2008Attracting
- Page 110 and 111: Additional Contents 2008Social serv
- Page 112 and 113: Additional Contents 2008TrainingWe
- Page 114 and 115: Additional Contents 2008TreiNetSinc
- Page 116 and 117: Additional Contents 2008Periodic me
- Page 118 and 119: Additional Contents 2008Improved Su
- Page 120 and 121: Additional Contents 2008Inventory a
- Page 122 and 123: Additional Contents 2008Eco-Efficie
- Page 124 and 125: Additional Contents 2008Courier, Ca
- Page 126 and 127: Additional Contents 2008New sustain
- Page 129 and 130: Additional Contents 2008Projects Sp
- Page 131 and 132: Additional Contents 2008trees as of
- Page 133 and 134:
Additional Contents 2008Sponsorship
- Page 135 and 136:
Additional Contents 2008GRI Indicat
- Page 137 and 138:
Additional Contents 2008Ecoefficien
- Page 139 and 140:
Additional Contents 2008trations an
- Page 141 and 142:
Additional Contents 2008Keris - Gov
- Page 143 and 144:
Additional Contents 2008HR8 - Perce
- Page 145 and 146:
Additional Contents 2008Charter of
- Page 147 and 148:
Additional Contents 2008Code concer