- Page 3 and 4:
CONTENTS6810-18Foreword John Macdon
- Page 6:
FOREWORDAs is now widely known, we
- Page 9 and 10:
The European Year of Volunteering (
- Page 11 and 12:
1. VOLUNTEERING INFRASTRUCTURECONCE
- Page 16 and 17:
5. Other stakeholdersIn terms of th
- Page 18 and 19:
Local Volunteer Service of Tirana,
- Page 20 and 21:
1. VOLUNTEERING INFRASTRUCTURECONCE
- Page 22 and 23:
In our opinion there is an ambivale
- Page 24 and 25:
in CSR projects. Companies with sig
- Page 26 and 27:
10. Additional countryspecificities
- Page 28 and 29:
3CHAPTERLBEDUTCH-SPEAKINGCOMMUNITYG
- Page 30 and 31:
2. Volunteering landscapeVolunteeri
- Page 33 and 34:
operates as a volunteer support cen
- Page 35:
8. Ethics and quality standardsfor
- Page 38:
1. VOLUNTEERING INFRASTRUCTURECONCE
- Page 42 and 43:
nominated by the King, which are th
- Page 45 and 46:
schools have parent associations wh
- Page 47 and 48:
8. Ethics and quality standards for
- Page 49 and 50:
ResourcesBelgian Red Cross, 2011. G
- Page 51 and 52:
1. VOLUNTEERING INFRASTRUCTURECONCE
- Page 53 and 54:
To conclude, in Bosnia and Herzegov
- Page 55 and 56:
can state that more volunteering wi
- Page 57 and 58:
4. Structure of the non-profit sect
- Page 59 and 60:
Herzegovina include CSR in their po
- Page 61 and 62:
8. Ethics and quality standards for
- Page 63 and 64:
2. Recommendations for local author
- Page 65 and 66:
CRO5CHAPTERATIVOLUNTEERINGINFRASTRU
- Page 67 and 68:
Besides the principles embedded in
- Page 69 and 70:
The National Strategy for the Creat
- Page 71 and 72:
Only 6% of theorganisationswho had
- Page 73 and 74:
promotional activities, with the ai
- Page 75 and 76:
8. Ethics and quality standardsfor
- Page 77 and 78:
Recommendations on a European level
- Page 79 and 80:
1. VOLUNTEERING INFRASTRUCTURECONCE
- Page 81 and 82:
of different abilities and socio-ec
- Page 83 and 84:
As in most geographical contexts, t
- Page 85 and 86:
3. Legal framework for volunteering
- Page 87 and 88:
Non-profit companies: Non-profit co
- Page 89 and 90:
such a boundary exists) the arena e
- Page 91 and 92:
associations, a large part acting a
- Page 93 and 94:
A similar context occurs in the pol
- Page 95 and 96:
7. Regular and systematic researchT
- Page 97 and 98:
The building of a truly enabling en
- Page 99 and 100:
7CHAPTERCVOLUNTEERINGINFRASTRUCTURE
- Page 101 and 102:
2. Volunteering landscapeDefinition
- Page 103 and 104:
Table 4: Likelihood of Volunteering
- Page 105 and 106:
In the Czech Republic, a system of
- Page 107 and 108:
People in Need is a humanitarian or
- Page 109 and 110:
8. Ethics and quality standardsfor
- Page 111 and 112:
VOLUNTEERINGINFRASTRUCTURECHAPTERDE
- Page 113 and 114:
Volunteer is a person who undertake
- Page 115 and 116:
However, a recent population survey
- Page 117 and 118:
4. Structure of the non-profit sect
- Page 119 and 120:
6. FUNDINGOPPORTUNITIESIn Denmark b
- Page 121 and 122:
10. Additional countryspecificities
- Page 123 and 124:
1. VOLUNTEERING INFRASTRUCTURECONCE
- Page 125 and 126:
organisations in the South (mostly
- Page 127 and 128:
However, more recent studies from 2
- Page 129 and 130:
3. Legal framework for volunteering
- Page 131 and 132:
of those were active in 2007 29 . I
- Page 133 and 134:
GroupsSocial and health association
- Page 135 and 136:
important role in the development a
- Page 137 and 138:
• Agreements with private compani
- Page 139 and 140:
• Development of models and estab
- Page 141 and 142: 1 0FRCHAPTERANVOLUNTEERINGINFRASTRU
- Page 143 and 144: 2. Volunteering landscapeIn France,
- Page 145 and 146: works to promote the sector in its
- Page 147 and 148: Some large companies have set up vo
- Page 149 and 150: 9. Awareness of volunteeringopportu
- Page 151 and 152: GCHAPTERER1MA1VOLUNTEERINGINFRASTRU
- Page 153 and 154: Besides that there is a large secto
- Page 155 and 156: Participation could be used as a st
- Page 157 and 158: In 13 years, thenumber of civilenga
- Page 159 and 160: Each federal state has offices or d
- Page 161 and 162: 7. Regular and systematic researchS
- Page 163 and 164: For the establishment of a strategi
- Page 165 and 166: 1. VOLUNTEERING INFRASTRUCTURECONCE
- Page 167 and 168: Financial support tovolunteering or
- Page 169 and 170: 11. RecommendationsThe Greek Govern
- Page 171 and 172: 1. VOLUNTEERING INFRASTRUCTURECONCE
- Page 173 and 174: and merely supposes fill in a form
- Page 175 and 176: 3. Legal framework for volunteering
- Page 177 and 178: the exception of one, where there i
- Page 179 and 180: voluntary activity under larger fra
- Page 181 and 182: 8. Ethics and quality standards for
- Page 183 and 184: A National Strategy for Volunteerin
- Page 185 and 186: Hopkins Comparative Nonprofit Secto
- Page 187 and 188: 1. VOLUNTEERING INFRASTRUCTURECONCE
- Page 189 and 190: 18th and 19th centuries and was epi
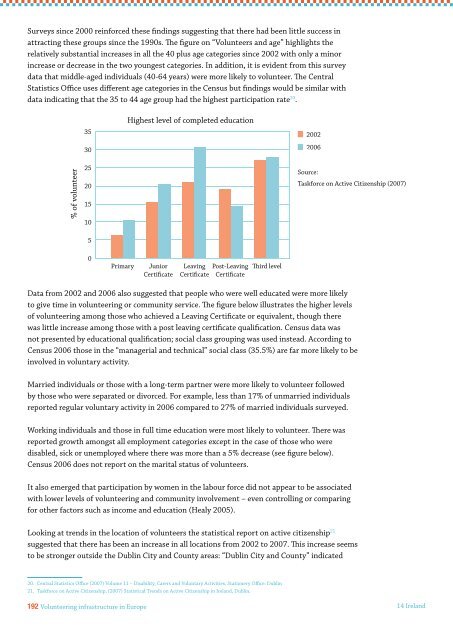
- Page 191: fact that data on volunteering need
- Page 195 and 196: Volunteer numbers, importance and c
- Page 197 and 198: Volunteer Infrastructure Volunteeri
- Page 199 and 200: to volunteer and not-for-profit org
- Page 201 and 202: Based on a full review of the needs
- Page 203 and 204: ResourcesCentral Statistics Office
- Page 205 and 206: 77.4% of volunteers have ahigh-scho
- Page 207 and 208: organisation, while the remaining 2
- Page 209 and 210: Volunteering is perceived as being
- Page 211 and 212: the voluntary activities in their R
- Page 213 and 214: and political representations to th
- Page 215 and 216: or 2011, the possibility of ceasing
- Page 217 and 218: 7. Regular and systematicresearchSy
- Page 219 and 220: 9. Awareness of volunteeringopportu
- Page 221 and 222: CSVnet, 2009. Manifesto of Voluntee
- Page 223 and 224: 1. VOLUNTEERING INFRASTRUCTURECONCE
- Page 225 and 226: According to the study, responses o
- Page 227 and 228: In general, the perception of volun
- Page 229 and 230: written certification regarding the
- Page 231 and 232: preparation of different campaigns
- Page 233 and 234: Even though the idea is really nobl
- Page 235 and 236: In Latviathere is nogovernmentalor
- Page 237 and 238: 8. Ethics and quality standardsfor
- Page 239 and 240: Factum Research Studio, 2010. Aptau
- Page 241 and 242: 1. VOLUNTEERING INFRASTRUCTURECONCE
- Page 243 and 244:
volunteering. Additionally, 28.5 %
- Page 245 and 246:
There are a variety of organisation
- Page 247 and 248:
8. Ethics and quality standardsfor
- Page 249 and 250:
ResourcesOfficial Gazette of Republ
- Page 251 and 252:
1. VOLUNTEERING INFRASTRUCTURECONCE
- Page 253 and 254:
An indication of the profile of vol
- Page 255 and 256:
3. Legal framework for volunteering
- Page 257 and 258:
The introduction of new elements, s
- Page 259 and 260:
4. Structure of the non-profit sect
- Page 261 and 262:
volunteers forming part of the Prog
- Page 263 and 264:
with an organisation as part of the
- Page 265 and 266:
Civil Society FundAdministered by t
- Page 267 and 268:
9. Awareness of volunteeringopportu
- Page 269 and 270:
ResourcesChapter 327 of the Laws of
- Page 271 and 272:
1MOCHAPTER9LDVOLUNTEERINGINFRASTRUC
- Page 273 and 274:
Moldavian law on volunteering defin
- Page 275 and 276:
4. Structure of the non-profit sect
- Page 277 and 278:
8. Ethics and quality standardsfor
- Page 279 and 280:
ResourcesState Register of Legal Ac
- Page 281 and 282:
1. VOLUNTEERING INFRASTRUCTURECONCE
- Page 283 and 284:
standpoints” 1 . However, despite
- Page 285 and 286:
However, the results of research sh
- Page 287 and 288:
10. Additional countryspecificities
- Page 289 and 290:
1. VOLUNTEERING INFRASTRUCTURECONCE
- Page 291 and 292:
ageing population in the Netherland
- Page 293 and 294:
4. Structure of the non-profit sect
- Page 295 and 296:
Netherlands. Volunteer centres also
- Page 297 and 298:
Service-learning in the Netherlands
- Page 299 and 300:
The total amount of hoursvolunteers
- Page 301 and 302:
A successful European Year of Volun
- Page 303 and 304:
Be aware of the changing motivation
- Page 305 and 306:
CHAPTER2O2PVOLUNTEERINGINFRASTRUCTU
- Page 307 and 308:
The Polish third sectorconsist of a
- Page 309 and 310:
On the other hand main people’s m
- Page 311 and 312:
The Council of Volunteer centres Ne
- Page 313 and 314:
5. Other stakeholdersCompaniesVolun
- Page 315 and 316:
involve them in shaping the Union
- Page 317 and 318:
7. Regular and systematic researchR
- Page 319 and 320:
“volunteer friendly criteria”.
- Page 321 and 322:
An importantobstacle forvolunteerin
- Page 323 and 324:
iblioteka.ngo.pl/public/ksiazki/wol
- Page 325 and 326:
1. VOLUNTEERING INFRASTRUCTURECONCE
- Page 327 and 328:
3. Legal framework for volunteering
- Page 329 and 330:
Holy Houses of MercyThe first Holy
- Page 331 and 332:
8. Ethics and quality standards for
- Page 333 and 334:
2CHAPTER4ROVOLUNTEERINGINFRASTRUCTU
- Page 335 and 336:
The resources included refer to ena
- Page 337 and 338:
Thirdly, the communist legacy of th
- Page 339 and 340:
udgets at all levels. One of the ma
- Page 341 and 342:
Within the registered non-profit en
- Page 343 and 344:
Educational institutionsVolunteerin
- Page 345 and 346:
In 2011, more than1,6 million Roman
- Page 347 and 348:
hypothesis of constant growth in th
- Page 349 and 350:
members of the network, meeting rep
- Page 351 and 352:
11. RecommendationsRomania has a lo
- Page 353 and 354:
25SLCHAPTERVOLUNTEERINGINFRASTRUCTU
- Page 355 and 356:
It’s difficult to define thesitua
- Page 357 and 358:
is important. There are many exampl
- Page 359 and 360:
4. STRUCTURE of the non-profit sect
- Page 361 and 362:
There is a boomin employeevolunteer
- Page 363 and 364:
7. Regular and systematic researchI
- Page 365 and 366:
10. Additional country specificitie
- Page 367 and 368:
2CHAPTERSL6OVENVOLUNTEERINGINFRASTR
- Page 369 and 370:
In the Slovenian context, unpaid ac
- Page 371 and 372:
The Law on Volunteering represents
- Page 373 and 374:
Slovene Philanthropy initiated a pr
- Page 375 and 376:
Another widely supported recommenda
- Page 377 and 378:
1. VOLUNTEERING INFRASTRUCTURECONCE
- Page 379 and 380:
Table 2. Logics (1) of the Vertical
- Page 381 and 382:
(1) Each of these logics in the cre
- Page 383 and 384:
shows that, within the entities res
- Page 385 and 386:
a platform for dialogue between soc
- Page 387 and 388:
Businesses also have a role to play
- Page 389 and 390:
9. Awareness ofvolunteering opportu
- Page 391 and 392:
Fundación La Caixa, 2007. Buenas p
- Page 393 and 394:
1. VOLUNTEERING INFRASTRUCTURECONCE
- Page 395 and 396:
According to the latest study by th
- Page 397 and 398:
part of Switzerland.74% Swiss peopl
- Page 399 and 400:
10. Additional country specificitie
- Page 401 and 402:
CHAPTER92KUVOLUNTEERINGINFRASTRUCTU
- Page 403 and 404:
The strategy also expressed concern
- Page 405 and 406:
3. Legal framework for volunteering
- Page 407 and 408:
the Office for Civil Society does n
- Page 409 and 410:
The reduction in the incomeof the v
- Page 411 and 412:
9. Awareness of volunteeringopportu
- Page 413 and 414:
Low N., Butt S., Ellis Paine A. and
- Page 415 and 416:
1. VOLUNTEERING INFRASTRUCTURECONCE
- Page 417 and 418:
The Scottish governmentbudget for t
- Page 419 and 420:
11. RecommendationsWe would strongl
- Page 421 and 422:
1. VOLUNTEERING INFRASTRUCTURECONCE
- Page 423 and 424:
volunteering than they have roles t
- Page 425 and 426:
health and social care services are
- Page 427 and 428:
organisation’s reputation. Fifty
- Page 429 and 430:
CHAPTER92KUVOLUNTEERINGINFRASTRUCTU
- Page 431 and 432:
to benefit others or the environmen
- Page 433 and 434:
4. Structure of the non-profit sect
- Page 435 and 436:
volunteering. At a time when there
- Page 437 and 438:
8. Ethics and quality standards for
- Page 439 and 440:
ResourcesCharities Aid Foundation a