Applications of state space models in finance
Applications of state space models in finance
Applications of state space models in finance
You also want an ePaper? Increase the reach of your titles
YUMPU automatically turns print PDFs into web optimized ePapers that Google loves.
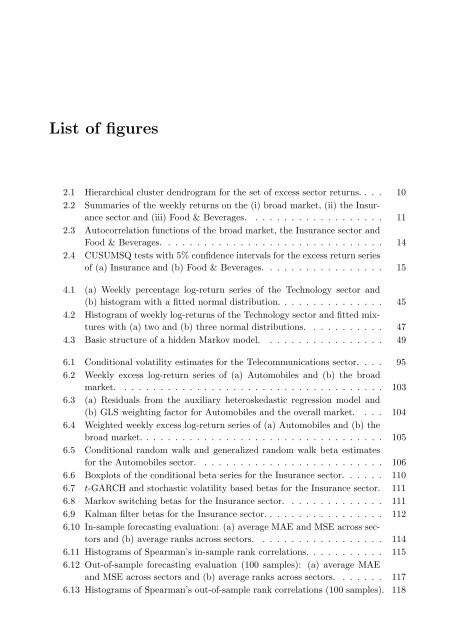
List <strong>of</strong> figures<br />
2.1 Hierarchical cluster dendrogram for the set <strong>of</strong> excess sector returns. . . . 10<br />
2.2 Summaries <strong>of</strong> the weekly returns on the (i) broad market, (ii) the Insurance<br />
sector and (iii) Food & Beverages. . . . . . . . . . . . . . . . . . . 11<br />
2.3 Autocorrelation functions <strong>of</strong> the broad market, the Insurance sector and<br />
Food & Beverages. . . . . . . . . . . . . . . . . . . . . . . . . . . . . . . 14<br />
2.4 CUSUMSQ tests with 5% confidence <strong>in</strong>tervals for the excess return series<br />
<strong>of</strong> (a) Insurance and (b) Food & Beverages. . . . . . . . . . . . . . . . . 15<br />
4.1 (a) Weekly percentage log-return series <strong>of</strong> the Technology sector and<br />
(b) histogram with a fitted normal distribution. . . . . . . . . . . . . . . 45<br />
4.2 Histogram <strong>of</strong> weekly log-returns <strong>of</strong> the Technology sector and fitted mixtures<br />
with (a) two and (b) three normal distributions. . . . . . . . . . . 47<br />
4.3 Basic structure <strong>of</strong> a hidden Markov model. . . . . . . . . . . . . . . . . 49<br />
6.1 Conditional volatility estimates for the Telecommunications sector. . . . 95<br />
6.2 Weekly excess log-return series <strong>of</strong> (a) Automobiles and (b) the broad<br />
market. . . . . . . . . . . . . . . . . . . . . . . . . . . . . . . . . . . . . 103<br />
6.3 (a) Residuals from the auxiliary heteroskedastic regression model and<br />
(b) GLS weight<strong>in</strong>g factor for Automobiles and the overall market. . . . 104<br />
6.4 Weighted weekly excess log-return series <strong>of</strong> (a) Automobiles and (b) the<br />
broad market. . . . . . . . . . . . . . . . . . . . . . . . . . . . . . . . . . 105<br />
6.5 Conditional random walk and generalized random walk beta estimates<br />
for the Automobiles sector. . . . . . . . . . . . . . . . . . . . . . . . . . 106<br />
6.6 Boxplots <strong>of</strong> the conditional beta series for the Insurance sector. . . . . . 110<br />
6.7 t-GARCH and stochastic volatility based betas for the Insurance sector. 111<br />
6.8 Markov switch<strong>in</strong>g betas for the Insurance sector. . . . . . . . . . . . . . 111<br />
6.9 Kalman filter betas for the Insurance sector. . . . . . . . . . . . . . . . . 112<br />
6.10 In-sample forecast<strong>in</strong>g evaluation: (a) average MAE and MSE across sectors<br />
and (b) average ranks across sectors. . . . . . . . . . . . . . . . . . 114<br />
6.11 Histograms <strong>of</strong> Spearman’s <strong>in</strong>-sample rank correlations. . . . . . . . . . . 115<br />
6.12 Out-<strong>of</strong>-sample forecast<strong>in</strong>g evaluation (100 samples): (a) average MAE<br />
and MSE across sectors and (b) average ranks across sectors. . . . . . . 117<br />
6.13 Histograms <strong>of</strong> Spearman’s out-<strong>of</strong>-sample rank correlations (100 samples). 118


