

Applications of state space models in finance
Applications of state space models in finance
Applications of state space models in finance

You also want an ePaper? Increase the reach of your titles
YUMPU automatically turns print PDFs into web optimized ePapers that Google loves.
2.2 Empirical properties 11<br />
p t<br />
R t (%)<br />
100 * R t (%) * R t (%)<br />
600<br />
500<br />
400<br />
300<br />
200<br />
100<br />
20<br />
10<br />
0<br />
−10<br />
−20<br />
200<br />
150<br />
100<br />
50<br />
0<br />
(a) Broad<br />
1990 1995 2000 2005<br />
1990 1995 2000 2005<br />
1990 1995 2000 2005<br />
p t<br />
R t (%)<br />
100 * R t (%) * R t (%)<br />
600<br />
500<br />
400<br />
300<br />
200<br />
100<br />
20<br />
10<br />
0<br />
−10<br />
−20<br />
500<br />
400<br />
300<br />
200<br />
100<br />
0<br />
(b) Insurance<br />
1990 1995 2000 2005<br />
1990 1995 2000 2005<br />
1990 1995 2000 2005<br />
p t<br />
R t (%)<br />
100 * R t (%) * R t (%)<br />
600<br />
500<br />
400<br />
300<br />
200<br />
100<br />
20<br />
10<br />
0<br />
−10<br />
−20<br />
200<br />
150<br />
100<br />
50<br />
0<br />
(c) Food & Beverages<br />
1990 1995 2000 2005<br />
1990 1995 2000 2005<br />
1990 1995 2000 2005<br />
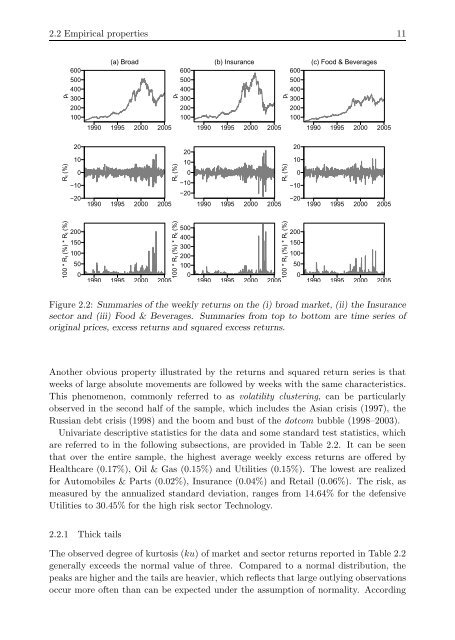
Figure 2.2: Summaries <strong>of</strong> the weekly returns on the (i) broad market, (ii) the Insurance<br />
sector and (iii) Food & Beverages. Summaries from top to bottom are time series <strong>of</strong><br />
orig<strong>in</strong>al prices, excess returns and squared excess returns.<br />
Another obvious property illustrated by the returns and squared return series is that<br />
weeks <strong>of</strong> large absolute movements are followed by weeks with the same characteristics.<br />
This phenomenon, commonly referred to as volatility cluster<strong>in</strong>g, can be particularly<br />
observed <strong>in</strong> the second half <strong>of</strong> the sample, which <strong>in</strong>cludes the Asian crisis (1997), the<br />
Russian debt crisis (1998) and the boom and bust <strong>of</strong> the dotcom bubble (1998–2003).<br />
Univariate descriptive statistics for the data and some standard test statistics, which<br />
are referred to <strong>in</strong> the follow<strong>in</strong>g subsections, are provided <strong>in</strong> Table 2.2. It can be seen<br />
that over the entire sample, the highest average weekly excess returns are <strong>of</strong>fered by<br />
Healthcare (0.17%), Oil & Gas (0.15%) and Utilities (0.15%). The lowest are realized<br />
for Automobiles & Parts (0.02%), Insurance (0.04%) and Retail (0.06%). The risk, as<br />
measured by the annualized standard deviation, ranges from 14.64% for the defensive<br />
Utilities to 30.45% for the high risk sector Technology.<br />
2.2.1 Thick tails<br />
The observed degree <strong>of</strong> kurtosis (ku) <strong>of</strong> market and sector returns reported <strong>in</strong> Table 2.2<br />
generally exceeds the normal value <strong>of</strong> three. Compared to a normal distribution, the<br />
peaks are higher and the tails are heavier, which reflects that large outly<strong>in</strong>g observations<br />
occur more <strong>of</strong>ten than can be expected under the assumption <strong>of</strong> normality. Accord<strong>in</strong>g


