- Page 4 and 5: IVTable of Contents - KazaloProfess
- Page 7 and 8: Calculation of stress-strain depend
- Page 9 and 10: Calculation of stress-strain depend
- Page 11 and 12: () = (, )() () ()Calculation
- Page 13 and 14: , ) (, )(, ) 1 () + = (, ) =
- Page 15 and 16: Calculation of stress-strain depend
- Page 17 and 18: Calculation of stress-strain depend
- Page 19 and 20: Calculation of stress-strain depend
- Page 21 and 22: RMZ - Materials and Geoenvironment,
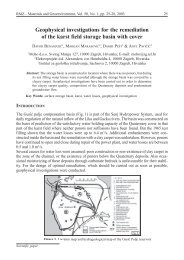
- Page 23 and 24: Petrochemical characteristics and g
- Page 25 and 26: Petrochemical characteristics and g
- Page 27 and 28: Petrochemical characteristics and g
- Page 29 and 30: Petrochemical characteristics and g
- Page 31 and 32: Petrochemical characteristics and g
- Page 34 and 35: 360 Akinola, O. O., Talabi, A. O.A
- Page 36 and 37: 362 Akinola, O. O., Talabi, A. O.of
- Page 38 and 39: 364 Sunmonu, L. A., Adagunodo, T. A
- Page 40 and 41: 366 Sunmonu, L. A., Adagunodo, T. A
- Page 42 and 43: 368 Sunmonu, L. A., Adagunodo, T. A
- Page 44 and 45: 370 Sunmonu, L. A., Adagunodo, T. A
- Page 46 and 47: 372 Sunmonu, L. A., Adagunodo, T. A
- Page 48 and 49: 374 Sunmonu, L. A., Adagunodo, T. A
- Page 50 and 51: 376 Sunmonu, L. A., Adagunodo, T. A
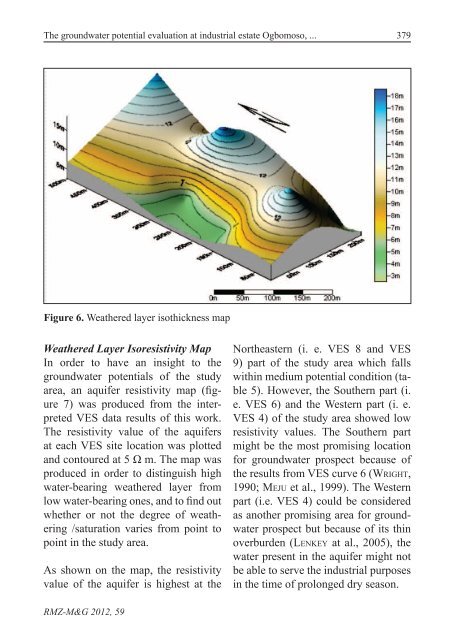
- Page 54 and 55: 380 Sunmonu, L. A., Adagunodo, T. A
- Page 56 and 57: 382 Sunmonu, L. A., Adagunodo, T. A
- Page 58 and 59: 384 Sunmonu, L. A., Adagunodo, T. A
- Page 60 and 61: 386 Sunmonu, L. A., Adagunodo, T. A
- Page 62 and 63: 388 Sunmonu, L. A., Adagunodo, T. A
- Page 64 and 65: 390 Sunmonu, L. A., Adagunodo, T. A
- Page 66 and 67: 392 Shemetov, P. A., Bibik, I. P.in
- Page 68 and 69: 394 Shemetov, P. A., Bibik, I. P.
- Page 70 and 71: k =1.05+Dλ = 1+k =( s )396 Shemeto
- Page 72 and 73: 398 Shemetov, P. A., Bibik, I. P.si
- Page 74 and 75: у 3 b400 D = f eShemetov, P. A., B
- Page 76 and 77: V4BEK Q σBEad = ,commQрσV 01 +
- Page 78 and 79: 404 Shemetov, P. A., Bibik, I. P.wh
- Page 80 and 81: thrмR iλ = 2 λ= 100⋅exp[ −(
- Page 82 and 83: qLevel of average technical (theore
- Page 84 and 85: .6670.05=0.35k1,05+D avet( s3≥ Kt
- Page 86 and 87: RMZ-M&G 2012, 59
- Page 88 and 89: 414 Adewale, A., Olawale, O. O., Ma
- Page 90 and 91: 416 Adewale, A., Olawale, O. O., Ma
- Page 92 and 93: 418 Adewale, A., Olawale, O. O., Ma
- Page 94 and 95: 420 Adewale, A., Olawale, O. O., Ma
- Page 96 and 97: 422 Adewale, A., Olawale, O. O., Ma
- Page 98 and 99: 424 Adewale, A., Olawale, O. O., Ma
- Page 100 and 101: 426 Adewale, A., Olawale, O. O., Ma
- Page 102 and 103:
RMZ-M&G 2012, 59
- Page 104 and 105:
430 Kos, A., Dervarič, E.novega ve
- Page 106 and 107:
432 Kos, A., Dervarič, E.diamond w
- Page 108 and 109:
434 Kos, A., Dervarič, E.chines to
- Page 110 and 111:
436 Kos, A., Dervarič, E.the best
- Page 112 and 113:
438 Kos, A., Dervarič, E.Before th
- Page 114 and 115:
440 Kos, A., Dervarič, E.nally to
- Page 116 and 117:
RMZ-M&G 2012, 59
- Page 118 and 119:
444 Lajovic, A.disc brakes, further
- Page 120 and 121:
446 Lajovic, A.Slika 2. Izrez iz Si
- Page 122 and 123:
448 Lajovic, A.Livne lonce smo na n
- Page 124 and 125:
450 Lajovic, A.Ingersol pa je bil z
- Page 126 and 127:
452 Lajovic, A.Med delavci, ki so b
- Page 128 and 129:
454 Lajovic, A.imel vsak delavec na
- Page 130 and 131:
456 Lajovic, A.Slika 5. Izdelki Že
- Page 132 and 133:
458 Lajovic, A.pa se ni najbolje iz
- Page 134 and 135:
460 Lajovic, A.za delo. Promet na z
- Page 136 and 137:
462 Lajovic, A.Sredi osemdesetih le
- Page 138 and 139:
464 Lajovic, A.njem delu forme. Na
- Page 140 and 141:
466 Lajovic, A.Enourni film je mars
- Page 142 and 143:
RMZ-M&G 2012, 59
- Page 144 and 145:
470 Medved, J., Rosina, A., Vončin
- Page 146 and 147:
472 Author’s IndexAuthor`s Index,
- Page 148 and 149:
RMZ-M&G 2012, 59
- Page 150 and 151:
Contents476Phase contrast method fo
- Page 152:
Contents47859/4Calculation of stres
- Page 155 and 156:
Instructions to authors481Compositi
- Page 157 and 158:
Instructions to authors483NAVODILA
- Page 159 and 160:
Instructions to authors485Knjige:Ro
- Page 161 and 162:
Template487TEMPLATEThe title of the
- Page 163 and 164:
Template489References (Times New Ro
- Page 165 and 166:
Template491Obstajata dve sprejemlji